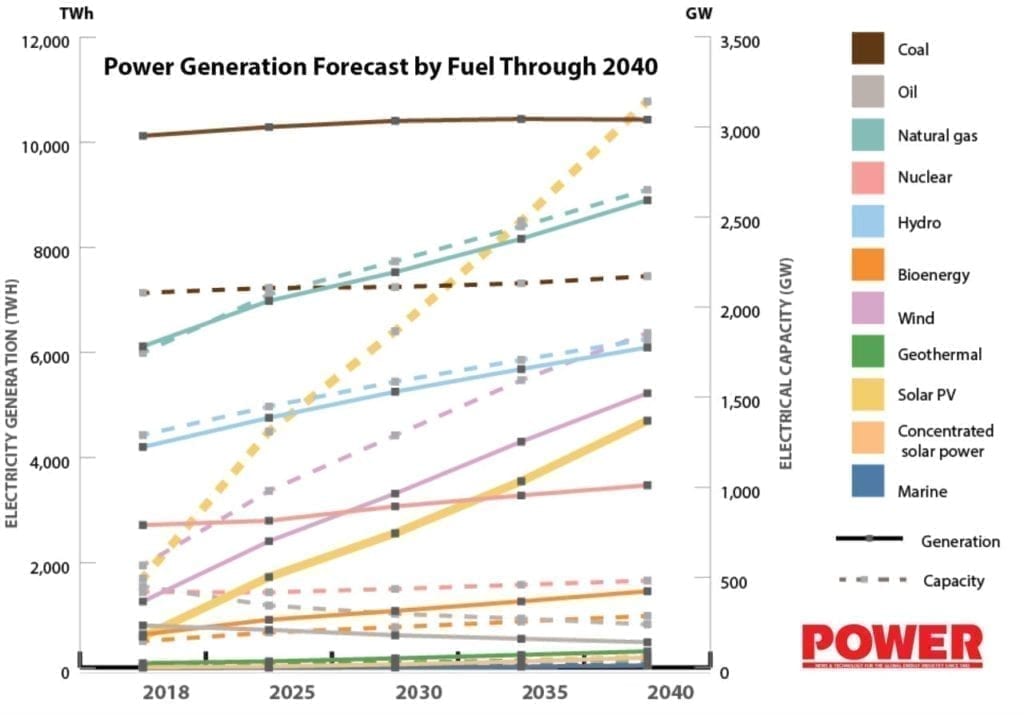
THE BIG PICTURE [Infographic]: Solar’s Explosive Growth
According to the International Energy Agency’s (IEA’s) World Energy Outlook 2019, solar photovoltaic (PV) is set to become the largest source of installed electrical capacity in about 2035, if countries pursue policies as planned. By 2040, solar could make up 24% of global installed capacity—up from 7% in 2018—but its share of generation could hover around 11%, up from 2% in 2018. In regions like China, solar could overtake coal in the power mix by the mid-2020s. The IEA’s projections for solar’s explosive growth are one of the largest differences between the current report and its 2018 edition. Sources: International Energy Agency, International Renewable Energy Agency.

Solar PV Installed Capacities (GW) by Region
According to the International Renewable Energy Agency (IRENA), global solar installations in 2018 were dominated by Asia, and Asia will continue to lead solar PV installations through 2050. IRENA notes that currently, annual additions are largely driven by utility-scale projects, reflecting the policies and financial support in various countries. Distributed solar, however, is picking up pace in a few countries, such as Germany. The agency’s projections for solar PV growth, which are even more ambitious than the IEA’s, suggest that at a global level, around 60% of total PV capacity in 2050 will be utility scale, and the remaining 40% will be distributed (mostly rooftop).

—Sonal Patel is a POWER senior associate editor (@sonalcpatel, @POWERmagazine)