Renewable power development will continue to grow in the U.S., with the nonhydro total reaching 53,121 MW by the end of 2016. So predicts a soon-to-be-released report from Boulder, Colo.–based Platts Analytics (which, like POWER, is a part of Platts, a division of The McGraw-Hill Companies). If all that capacity goes on-line, it would represent a 7.5% average annual increase since 2003, when 20,661 MW of renewable energy projects were operating, according to figures from the forthcoming "Renewable Power Outlook 2005."
According to Platts Analytics, the biggest gainer of all renewables will be wind, which by 2016 should reach 35,640 MW of installed capacity—representing 14.1% average annual growth from the 6,364 MW installed in 2003. During 2003 and 2004, wind power development was dampened by the expiration of the Renewable Energy Production Tax Credit (PTC), explained Platts Analytics consultant Jack Ihle. "The PTC really helped drive the price of wind-produced electricity down," he said. "With the PTC, wind Classes 4, 5, and 6 are currently competitive with the U.S. average wholesale power market price [Figure 3]. Without it, only Classes 5 and 6 are competitive." In October 2004 the PTC was renewed through 2005, but the American Wind Energy Association is pushing to have it extended through 2006.
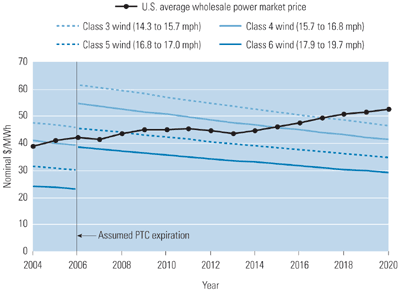
3. The comparative economics of wind power. This graph shows that if the U.S. Renewable Energy Production Tax Credit is allowed to expire again, only wind farms at the breeziest (Class 5 and 6) sites will be able to compete with conventional generation for many years. Unlike "normal" economic graphs, which show market factors gradually changing trends, this one reflects a policy-driven disconnect, which is why we have a data "gap": On December 31, 2006, Class 5 wind will cost $30; on Jan 1, 2007, it will cost $45, assuming the PTC expires at the end of 2006. Source: Platts Analytics
Platts sees installed wind capacity surging to 9,329 MW in 2005, to 16,198 MW in 2008, to 26,147 MW in 2012, and to 35,640 MW by 2016. Those figures assume a PTC in place only through 2006, though it could be reauthorized for additional years, explained Ihle.
In terms of megawatts, the next highest renewable energy capacity (after wind) should be generation fueled by wood and wood waste, which is predicted to reach 6,768 MW by 2016. That figure, however, would represent a nearly flat annual growth rate (0.3%) from 2003’s 6,549 MW. Why the stagnation? Ihle explained that a number of wood-fueled projects were built under the Public Utility Regulatory Policies Act, which required utilities to purchase power from alternative energy plants. Now that renewable portfolio standards (RPS) have become the main drivers of renewables development in the U.S., wood projects will have difficulty competing with wind on economic grounds, he said.
The predicted 2016 capacity and average rate of change in that capacity for other renewable energy sources are as follows:
• Geothermal, which will rise from 2,990 MW to 4,477 MW (3.2% annually).
• Municipal solid waste, which will drop 1.8% annually, from 2,869 MW to 2,272 MW (because some plants will be retired and states are reluctant to license new ones).
• Landfill gas, which will grow 5.7% annually from today’s 1,077 MW to 2,206 MW.
• Solar thermal, up 5.4%/year from 354 MW to 704 MW.
• Biomass, which will fall 0.3%/year from 325 MW to 314 MW.
• Photovoltaics, which will rise 14.2% annually from 132 MW to 740 MW.
Nonhydro renewables’ share of total U.S. generation is expected to increase from 2.8% to 5.5%, according to Platts. Some 208 TWh of output are predicted in 2016, with 103 TWh coming from wind. In 2003, the total was 105.9 TWh, with 17.7 TWh from wind.
As mentioned, the biggest driver of renewable energy development is now renewable portfolio standards; according to Platts, RPS will provide 80% of the impetus for development. Voluntary efforts, such as utility or marketer green power offerings, will provide another 15%, while state programs funded by "societal benefits charges" in rates will account for the rest.
"Renewable Power Outlook 2005" is available as a single report or as part of the Platts Power Outlook Research Service. For more information, contact Jack Ihle at jack_ihle@platts.com.