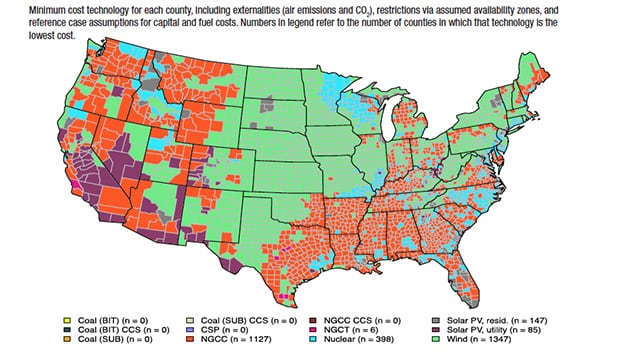
Natural gas combined cycle, wind, and residential solar photovoltaic technologies may be the least-expensive way to generate power across a wide swathe of the U.S., an interactive map published and recently updated by the University of Texas (UT) at Austin’s Energy Institute shows.
The interactive chart (Version 1.4.0, retrieved on October 4, 2018), first published in 2016, breaks down the cheapest technologies, ranked by levelized cost of electricity (LCOE), and assigns them to every U.S. county as well as congressional district. Technologies include: coal (bituminous and sub-bituminous, with partial (30%) and full (90%) carbon capture and sequestration); natural gas combined cycle, with and without carbon capture and sequestration); natural gas combustion turbine; nuclear; onshore wind; solar PV (utility and residential); and concentrating solar power (with six hours of storage).
According to Dr. Joshua Rhodes, postdoctoral research fellow at the Energy Institute and lead author of the paper, the cost estimates are based on a series of assumptions that researchers debated at length. The cost assumptions, specifically capital costs, that underlie each generating technology were recently updated, he said in late September.
Natural Gas, Wind Dominate Landscape
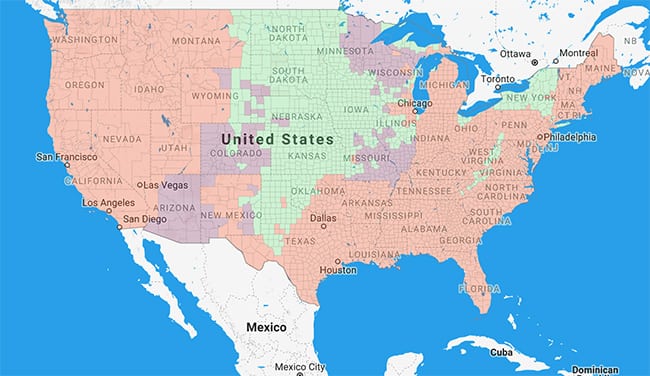
The map shows that natural gas combined cycle is the cheapest technology for large swathes of the eastern and western U.S—even at a fuel price of $5.07/MMBtu. At that gas price, solar PV is the cheapest in a large part of Arizona, Colorado, Wisconsin, Minnesota, and Missouri. In the central U.S., wind dominates as the cheapest technology.
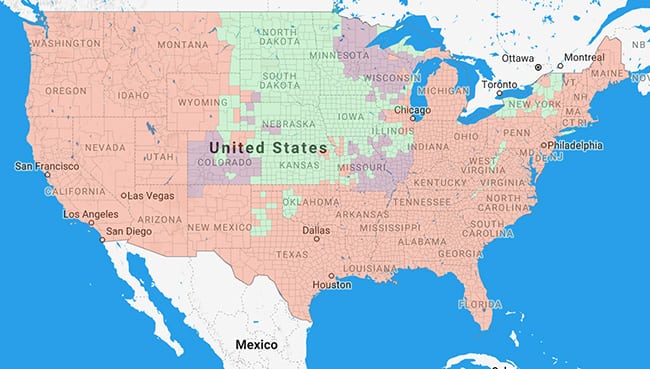
If a $3.24/MMBtu price for natural gas is assumed, natural gas combined cycle becomes the cheapest in nearly all counties outside the central U.S.
The map, which allows users to change the capital cost assumptions, discount rates, fuel costs and even include externalities such as carbon dioxide emissions, now also allows users to view the cheapest technology by congressional district. It suggests that of the 240 Republican districts in the continental U.S., 157 have wind or solar as their cheapest electricity option.
For the 192 districts that Democrats represent, 105 have wind or solar as their cheapest option.
About the Map
The map stems from an analysis that a wide range of UT experts—in the fields of mechanical engineering, policy, public affairs, finance, electromechanics, chemical engineering, and others—compiled to calculate the LCOE of new power plants on a county-by-county basis, while including estimates of some environmental externalities.
The experts published their results in a July 2016 paper that is part of its “The Full Cost of Electricity (FCe)” initiative. The initiative employs a “holistic” approach to examine the key factors affecting the total system cost of generating and delivering electricity.
According to the paper, the LCOE—the estimated amount of money that it takes for a power plant to produce a kWh of electricity over its expected lifetime—for each county is calculated using a “geographically-resolved” method that starts with a conventional LCOE calculation and integrates costs from externalities, including air emissions, combustion CO2, and embedded lifecycle analysis greenhouse gases. Capital, operating, and fuel costs were spatially interpolated from point locations around the country to each county.
The Energy Institute notes that many organizations calculate LCOE values either for each year, future projections, or for specific clients. “LCOE typically only considers costs that are internal to the plant itself such as capital costs (CAPEX, costs to build the plant itself and any applicable CO2 pipelines, $/kW), debt service costs, fixed Operations and Maintenance costs (O&M, costs associated with the operations and maintenance of the plant, $/MW), variable O&M costs (costs associated with each unit of electricity generated, $/MWh), the heat rate (how much heat it takes to produce a unit of electricity, kJ/kWh (MMBtu/MWh)), the fuel cost (on a per unit of heat basis, $/GJ ($/MMBtu)), and the capacity factor (the amount of energy produced divided by the potential amount of energy that could be produced),” it notes.
“Despite its advantages and widespread use, the conventional LCOE has several shortcomings that render it spatially and temporally static,” it says. “Costs of building and operating an identical plant across different geographies will be different. Moreover, fuel costs, capacity factors and financing terms will differ across regions as well. However, LCOE does not readily incorporate these differences, LCOE can also be problematic because of the assumption of constant capacity factors over the lifetime of the plant.”
The institute’s analysis incorporates region-specific data on CAPEX, O&M and fuel costs, where available, and uses geographical interpolation techniques to calculate them on a county-by-county basis in the U.S.
—Sonal Patel is a POWER associate editor (@sonalcpatel, @POWERmagazine)