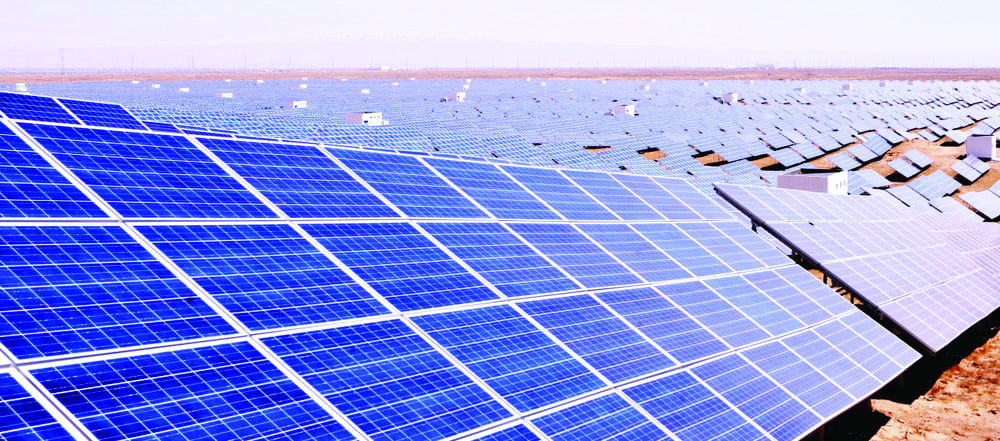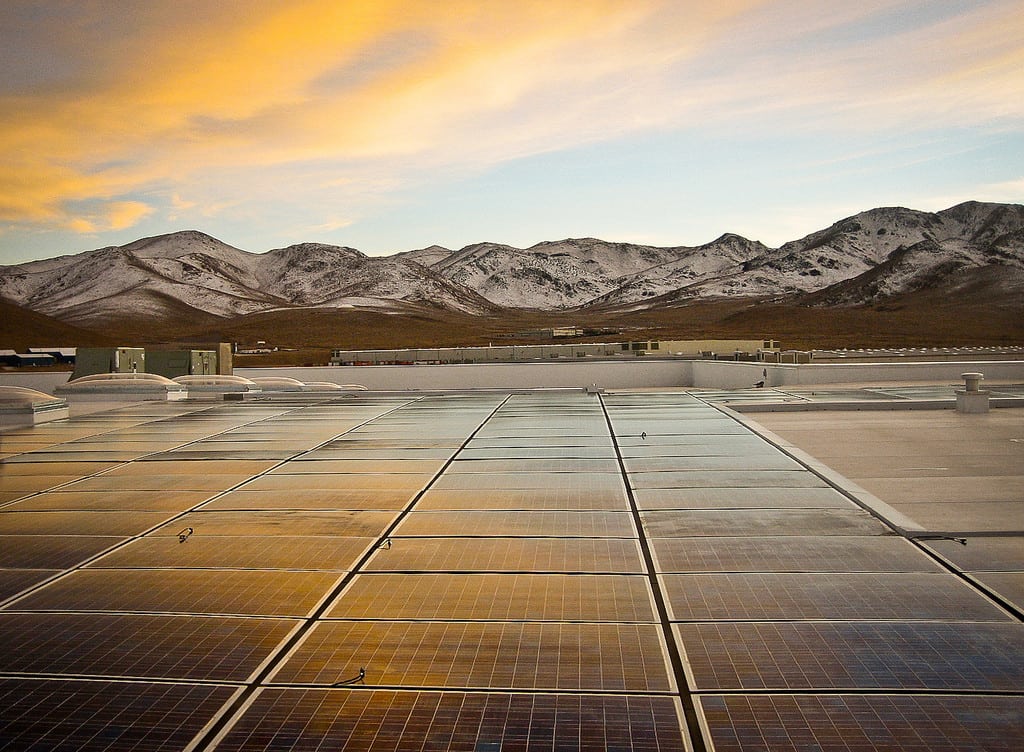
Burdened by a trade case, unpredictable policy-making, interconnection delays, and other market factors, the U.S. installed 30% less solar photovoltaic (PV) capacity in 2017 compared to a record-breaking 2016.
However, the 10.6 GW of new PV capacity added last year represents 30% of all new generating capacity added to the U.S. grid, more than any other power source but natural gas, and according to the Solar Energy Industries Association (SEIA), it is characteristic of solar PV’s booming growth. Last year’s capacity addition still represents 40% growth over 2015’s installation total, the trade group noted as it released its U.S. Solar Market Insight Report 2017 Year-in-Review, which it prepared with GTM Research, on March 15.
“The solar industry delivered impressively last year despite a trade case and market adjustments,” said SEIA President and CEO Abigail Ross Hopper. “Especially encouraging is the increasing geographic diversity in states deploying solar, from the Southeast to the Midwest, that led to a double-digit increase in total capacity.”
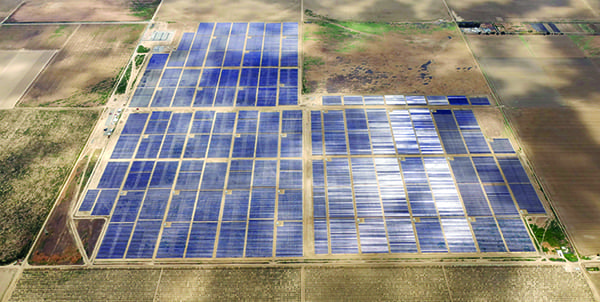
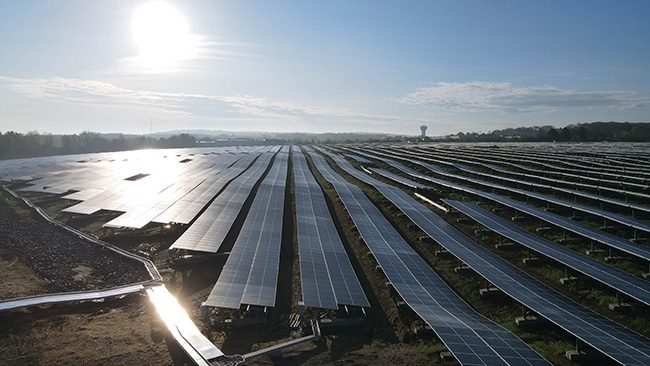
According to SEIA, growth in the sector in 2017 was driven mainly by the non-residential market segment, which grew 28% year-over-year, notching a marked increase in the community solar market led by Minnesota and Massachusetts.
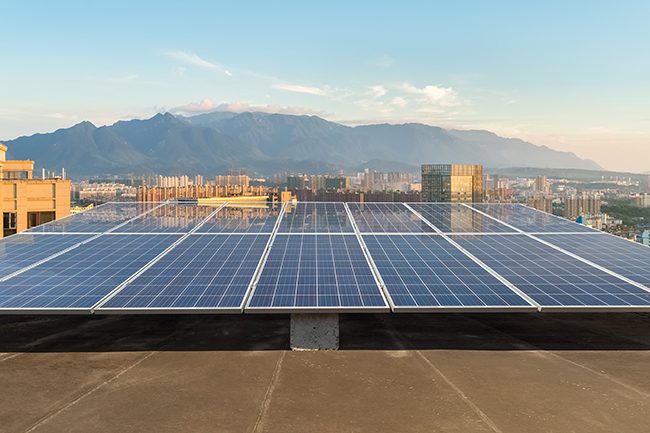
However, the report notes, the residential and utility-scale segments saw installations fall 16% on an annual basis for the first time since GTM Research and SEIA began publishing the review in 2010.
The residential sector’s 16% contraction compared to 2016 was driven by “weakness in California and major Northeast markets, which continue to feel the impact of pullback from certain national installers that have shifted away from rapid-expansion strategies,” the report says.
The overall 2017 downturn was largely expected, the groups said, considering “the massive influx of installations seen in 2016 as projects were rushed to completion before the anticipated expiration of the 30 percent federal Investment Tax Credit.”
The report notes, however, that many projects were postponed, “spilling over into 2018,” or canceled owing to uncertainty surrounding a Section 201 petition backed by two struggling solar companies, Suniva and SolarWorld Americas. The Trump administration in January acted on the high-profile trade case, slapping a 30% tariff on imports of solar modules and solar cells.
Uncertainty spurred by the Section 201 petition and a global shortage of Tier 1 module supply drove up module costs in the fourth quarter of 2017 in most PV market segments. Price increases were softened by falling prices in racking and inverters, which improved operating efficiencies like margin compression, the report noted, however.
SEIA also pegged project postponements or cancellations to interconnection delays and utility opposition against qualifying facility (QF) development under the Public Utilities Regulatory Policy Act (PURPA). The law enacted in 1978 to encourage energy conservation and development of renewable power generation as an alternative to fossil fuels requires that electric utilities purchase power produced by designated QFs, and it has been a solid driver for solar power uptake. However, states have urged fast-track reform of the act, saying the law is out of date and no longer functions as it should.
“Initially, PURPA was expected to be the largest driver of utility PV in 2017; however, continued utility pushback against new [QF] development led to project delays and cancellations,” the report notes. SEIA also noted that federal efforts to reform PURPA had kicked up. In November 2017, Rep. Tim Walberg (R-Mich.) introduced the PURPA Modernization Act of 2017 (HR 4476), a U.S. House bill that could stem development of additional QF renewables by allowing utilities to challenge the 1-mile rule and reject QF contracts based on having access to wholesale markets. The House Subcommittee on Energy held a hearing on the bill on January 19, but no action has been since taken and industry observers posit it has a slim chance of passage.
According to GTM Research, however, other federal and state policy changes, including the impact of Section 201, corporate tax reform, and market dynamics are expected to tamp down solar’s rapid growth between 2018 and 2022 by about 13%. But total installed U.S. PV capacity is still expected to more than double over the next five years. By 2023, more than 15 GW of PV capacity will be installed annually, the research firm said.
Meanwhile, about 10.6 GW alone will likely be added in 2018, and it won’t be driven wholly by incentives, SEIA noted. Corporate procurement drove 1 GW of additions both in 2017 and 2016. In 2017, while voluntary procurement was the largest driver of new capacity additions, spurring installations of 2.2 GW, a third of utility build-out in 2018 will be driven by voluntary procurement rather than state-mandated Renewable Portfolio Standards, SEIA projected. “We can expect corporate procurement to drive 5% to 12% of annual capacity additions over the next five years,” it added.
—Sonal Patel is a POWER associate editor (@sonalcpatel, @POWERmagazine)