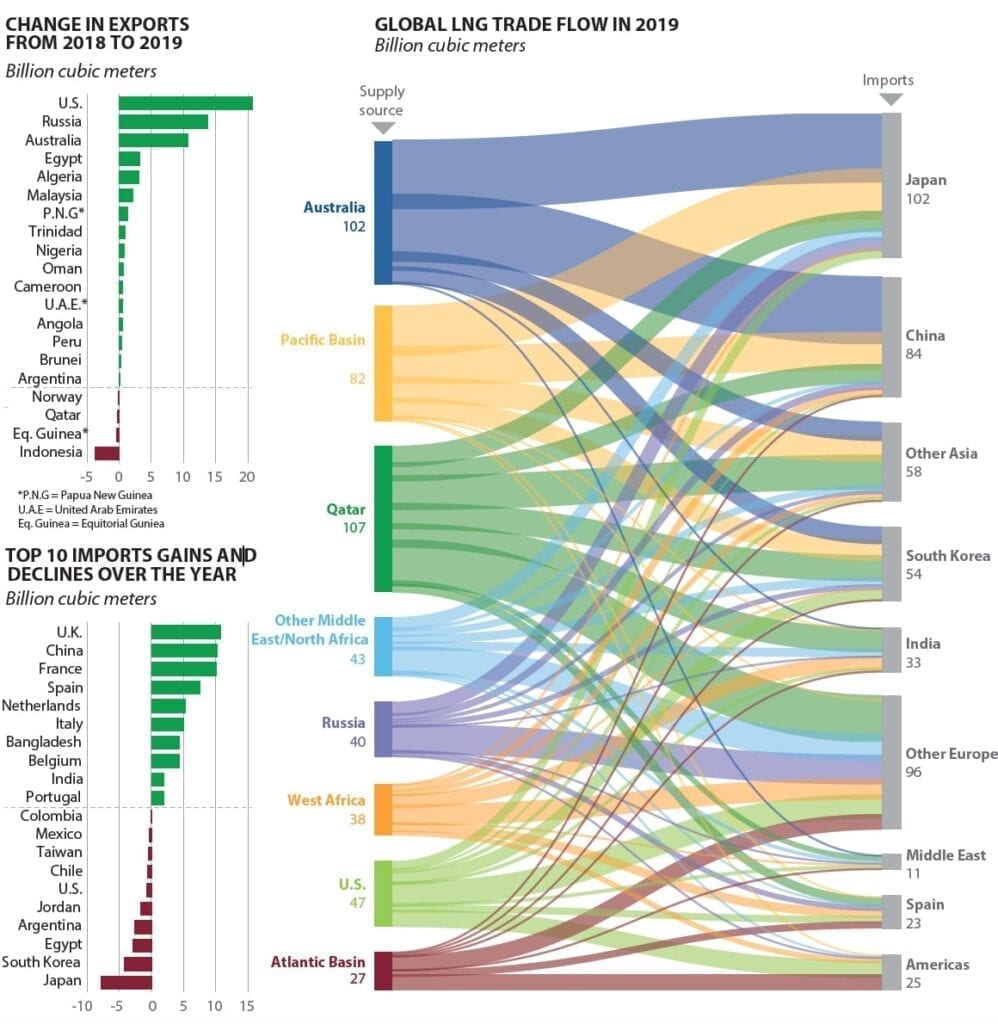
In 2019, global liquefied natural gas (LNG) imports reached 482 billion cubic meters, up 13% from 2018, according to BloombergNEF figures cited in the International Gas Union’s August–released Global Gas Report 2020. Last year, the world also saw a definitive shakeup in rankings of importers and exporters.
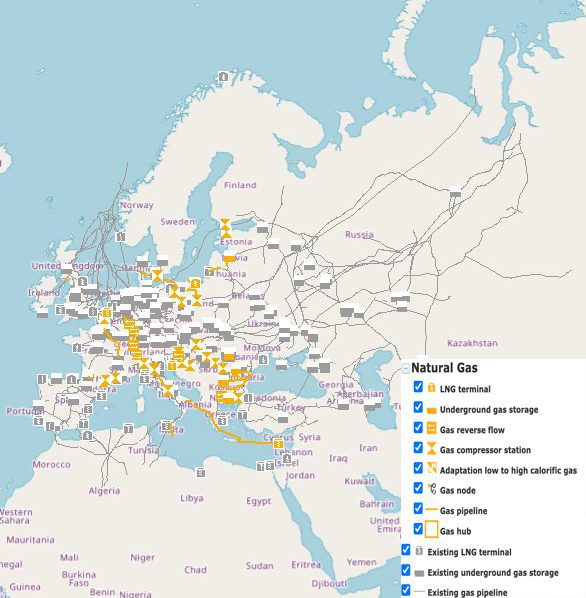
Compared to 2018, LNG imports by Japan and South Korea each fell 7%, while China imported 14% more LNG, taking South Korea’s spot as the world’s second-largest LNG importer. Europe, notably, also imported 76% more LNG than in 2018, reaching a record 117 billion cubic meters in 2019. Qatar retained the top export spot in 2019, but its share in the global supply market is now nearly tied with Australia’s. Whether these rankings will endure over 2020 remains uncertain owing to the COVID-19 pandemic, which widely dampened LNG trade.
Source: Global Gas Report 2020, BloombergNEF / International Gas Union / Snam 2020
Click on graphic or here for a larger version
—Sonal Patel, POWER senior associate editor.