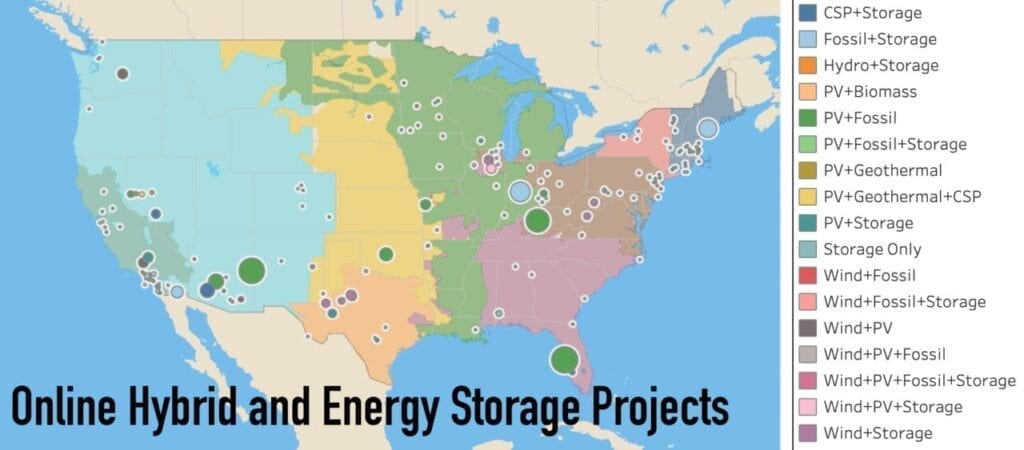
At the end of 2019, 125 projects larger than 1 MW were co-located with other generators or storage at a single point of interconnection across the U.S., according to a July 2020 report from Lawrence Berkeley National Laboratory. These “hybrid/co-located” projects, which exist in various configurations, represent a combined 13.4 GW of generating capacity and 0.9 GW of storage capacity.
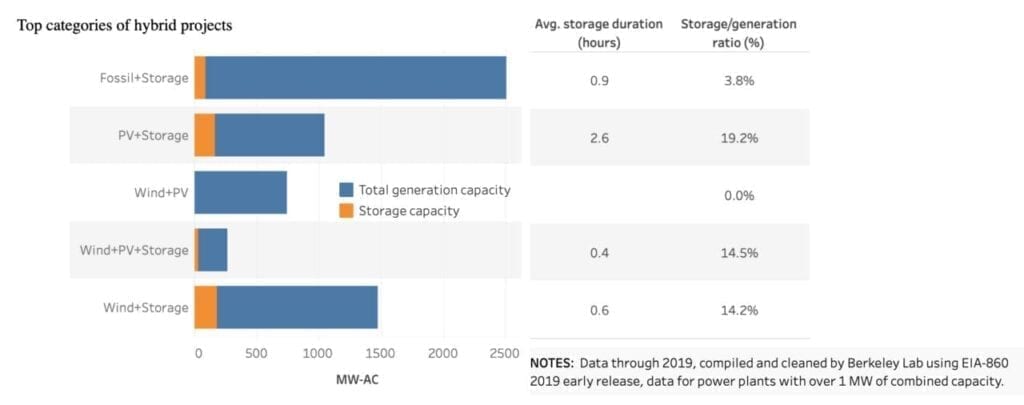
The top five most common hybrid configurations feature PV and fossil (7 GW), followed by fossil and storage (2.4 GW), wind and storage (1.2 GW), PV and storage (882 MW), and wind and PV (747 MW).
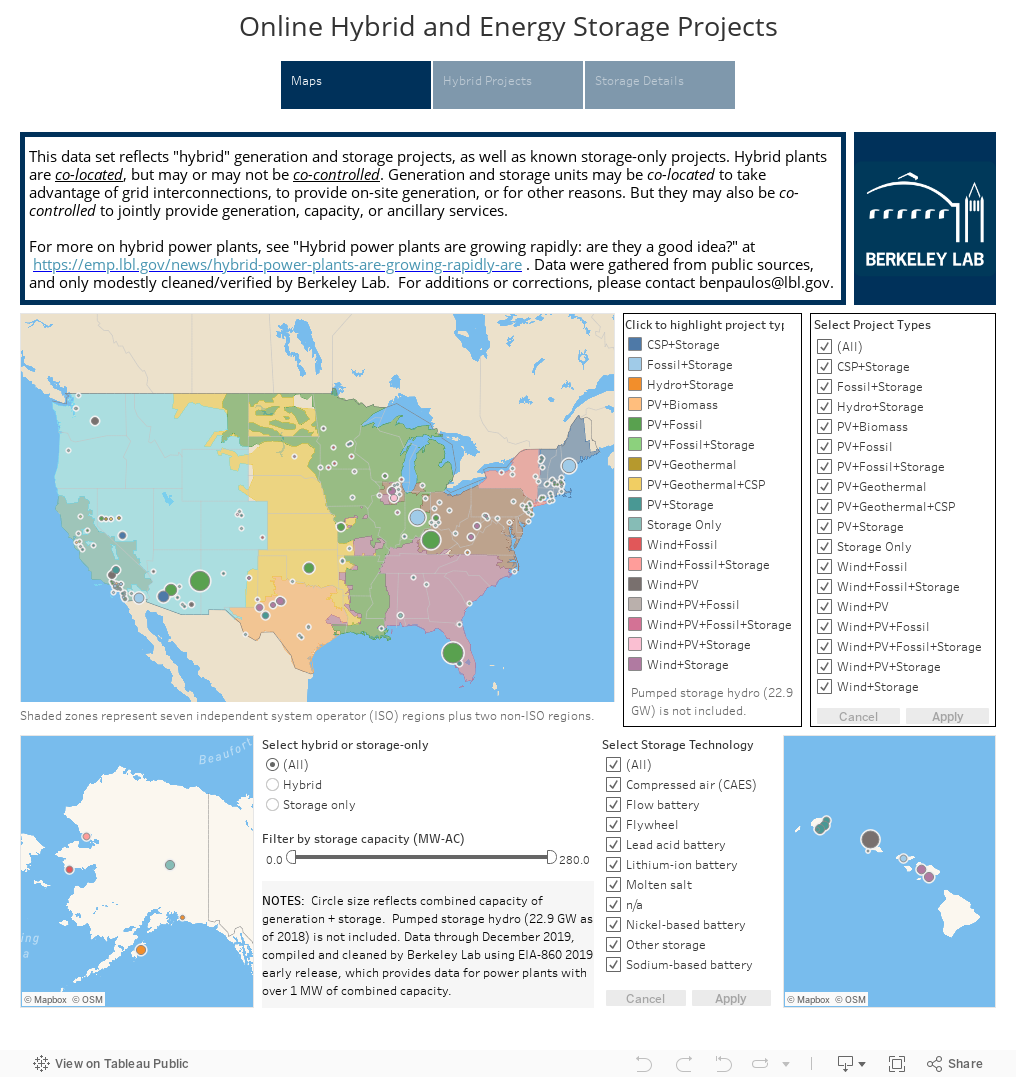
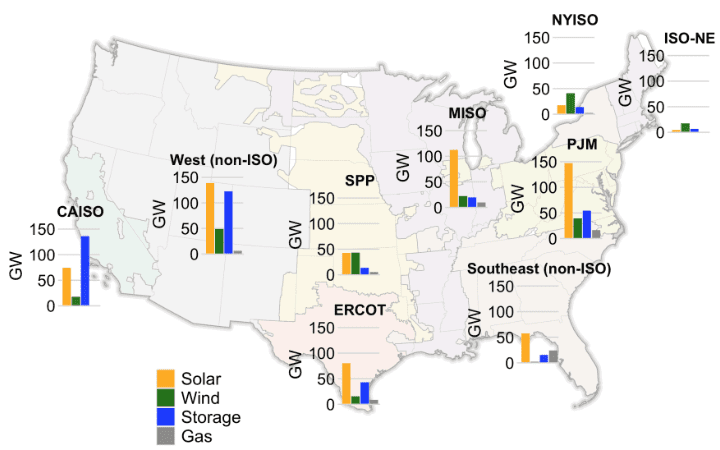
Lawrence Berkeley National Laboratory’s data visualization shows all hybrid project types of 1 MW or larger installed in the U.S. at the end of 2019. The full visualization includes a map that allows viewing by project type and storage technology. The full visualization can be explored here. Source: LBL
The researchers’ analysis, which also examined interconnection queues of seven independent system operators and 30 utilities (representing about 80% of U.S. load) at the end of 2019, also showed that interest in hybrid plants has increased substantially over the past five years. Nearly 28% of new solar capacity (102 GW) and 5% of wind capacity (11 GW) have been proposed as hybrids. Solar and storage, and wind and storage were more common than other hybrid types in the queues—but findings varied by region. California ISO and the non-ISO West are the two regions of greatest apparent commercial interest so far, the researchers said.
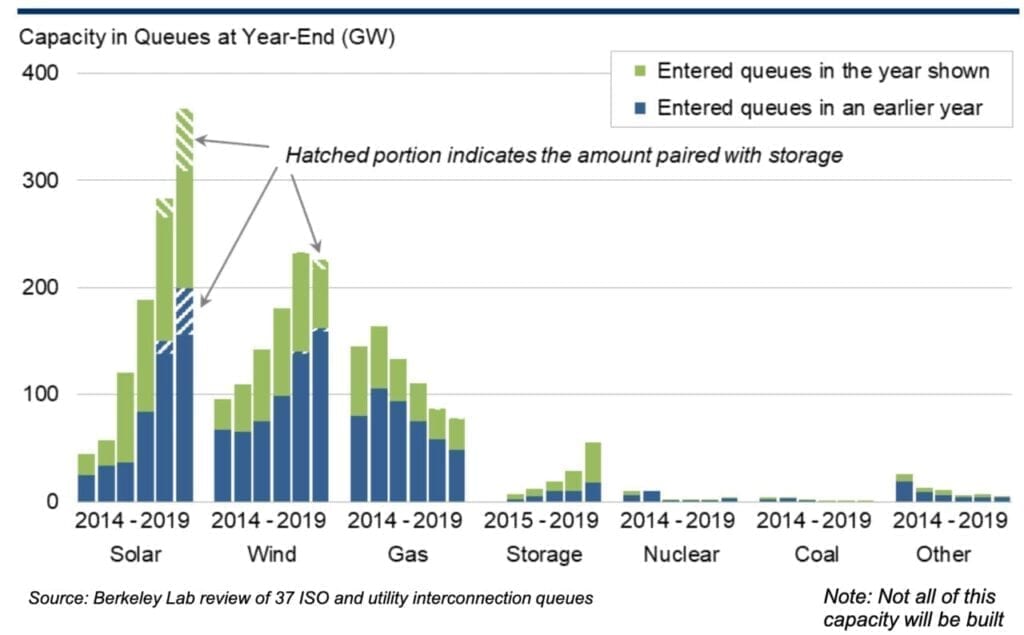
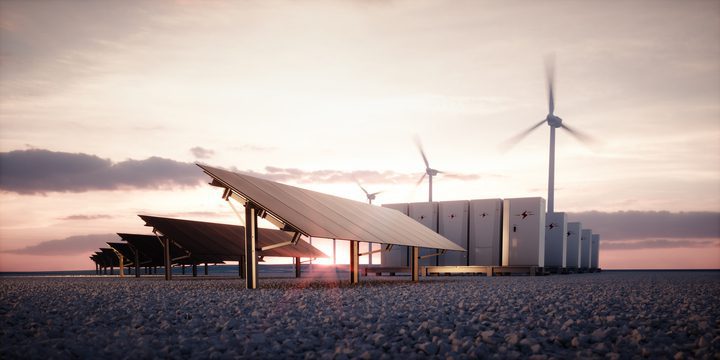
solar, wind, and storage has grown, including via hybridization. Source: LBL
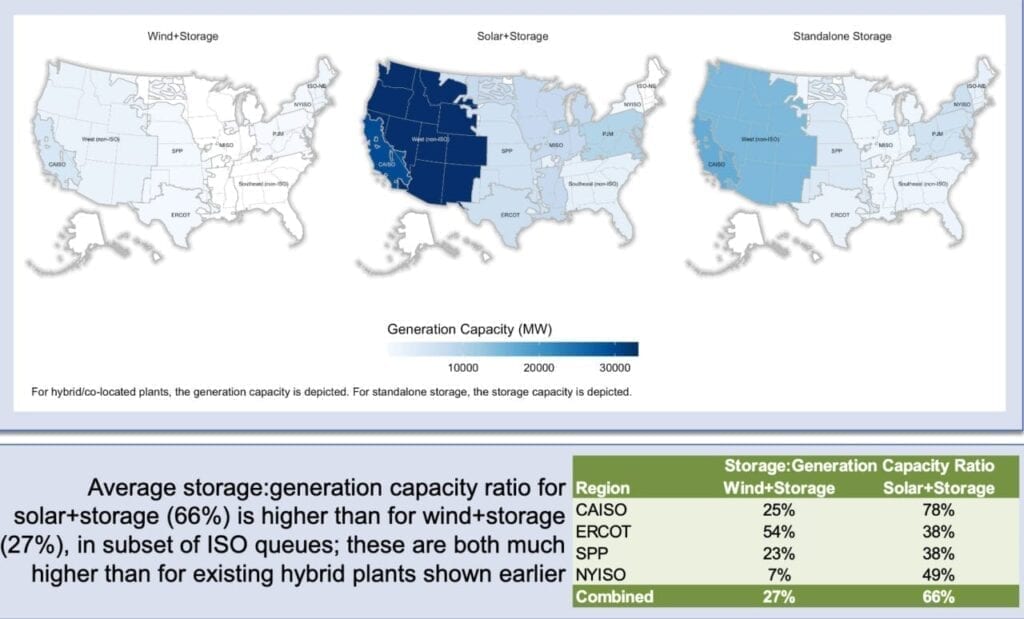
Among other findings are that storage generation ratios and storage durations tend to be higher for installed PV and storage plants. However, to date, standalone storage capacity (even excluding pumped hydro) exceeds storage in existing hybrids. Looking forward, the researchers suggest interest in hybrids will be dominated by solar and storage plants. That configuration could be installed at least 10 times more than wind and storage, they said. However, much remains unknown, because data availability for hybrid/colocated plants is still limited, especially given the wide variety of plant configurations, they cautioned. “Even standardized definitions for what constitutes a hybrid is lacking,” they noted.
Source: Wiser, R., Bolinger, M., Gorman, W., Rand, J., Jeong, S., Seel, J., et al. (2020). Hybrid Power Plants: Status of Installed and Proposed Projects. Lawrence Berkeley National Laboratory. Retrieved from https://escholarship.org/uc/item/9979w72n
—Sonal Patel is a POWER senior associate editor (@sonalcpatel, @POWERmagazine).