Slow Growth Ahead—with Unexpected Flares of Activity
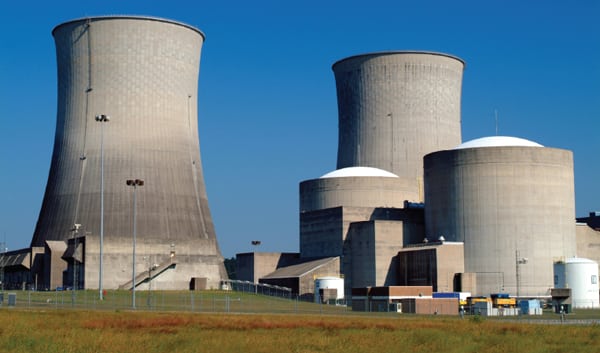 |
| Courtesy: Tennessee Valley Authority |
North American shale gas was supposed to realign the generation fleet here and abroad (thanks to anticipated exports) far into the future. Turns out, that’s not exactly how the near term is shaping up. Despite stagnant (and even putrid) economies and legislative bodies in the U.S. and EU, there promises to be sufficient market volatility to keep everyone alert.
The prospects for the U.S. power generating industry in 2013 aren’t exciting, but they are intriguing. Though familiar challenges remain—economic pain, regulatory rumbles, and legislative inaction—the natural gas and coal markets continue to defy year-ahead predictions, forcing everyone from generators to dispatchers to fuel suppliers to rethink their assumptions with now-predictable regularity.
Before looking ahead to 2013, consider what has set the stage for the new year.
Reading between the lines of the U.S. Energy Information Administration’s (EIA’s) Annual Energy Review 2012, there is much good news thoroughly mixed with much unmentioned bad news. Consider the following energy milestones that should be cause for celebration:
- The most hydroelectric power produced (in 2011) since 1999 (up 25% from a relatively dry 2007–2010).
- The most renewable energy (wind, solar, geothermal, and biomass) ever produced.
- The most natural gas produced in history. Dramatic increases from state and private lands made 2010 the year with the lowest volume of natural gas imports since 1992, principally due to hydraulic fracturing. The trend continued in 2012.
- U.S. CO2 emissions are expected to stay below 2005 levels through 2035, principally due to coal-to-gas fuel switching and a moribund economy. The low price of natural gas has also moderated or flattened electricity price increases in many parts of the country.
- A federal court determined that the Environmental Protection Agency’s (EPA’s) Cross State Air Pollution Rule (CSAPR) did not comply with the Clean Air Act. An EPA appeal is expected.
The often-overlooked industry lowlights—as we categorize them—are equally profound:
- The only new hydroelectric projects permitted were upgrades of existing plants and minuscule hydrokinetic and run-of-river projects. The last major hydroelectric plant built in the U.S. was almost 40 years ago, and none are planned for the future. In fact, many activist organizations are actively campaigning for removal of existing hydroelectric dams.
- The cost of renewable energy mandates was the primary cause of a 2.3% increase in the national average cost of residential electricity.
- The lowest amount of natural gas since 1993 was produced from public lands. The EPA is proposing additional gas well fracking rules that are predicted to drive up the production cost of natural gas. New offshore gas leases were suspended in early 2009 and have yet to be reinstated.
- The Sierra Club has announced a plan it calls “Beyond Natural Gas.” With its unveiling came the statement, “We’re going to be preventing new gas plants from being built wherever we can.” Unmentioned in that press release was the group’s long-held view that natural gas is a “bridge fuel”; now it is vilified as a “barrier” to the group’s goal of an economy devoid of fossil fuels.
- The EPA’s greenhouse gas rule complies with the Clean Air Act, according to the same federal court that struck down CSAPR. Industry appeals are pending.
The contrasting successes and failures amply illustrate there is no safe, middle ground when it comes to selecting the technologies for producing electricity. The middle ground has become the equivalent of an energy policy “no man’s land,” where Congress steps lightly, if at all.
The nation’s patchwork energy policy has devolved into what is in practice a “winner takes all” contest between regulators and fuel developers, rather than a consensus strategy that guides development. The imperfect Energy Policy Act of 2005 (remember Corridors of National Interest, and when regulating natural gas wells was delegated to individual states?) would be impossible to pass today because it represented compromise.
Despite the policy vacuum, developers of new gas fields have, through private investment, produced enormous quantities of low-priced natural gas that’s now available from private and state lands. Siding with them are proponents of an energy independence scenario in which fossil fuels figure prominently. We learned the valuable lesson that fossil fuels are finite, but in terms of centuries not years.
On the opposing side is the administration, often supported by environmental activist organizations, which has shown little support for expansion of the natural gas industry or domestic coal production but has for the past four years been preoccupied with distributing massive government subsidies for renewable technologies, continuing the decade-long trend of slowing the extraction of fossil fuels from public lands, and using the EPA’s regulatory authority to attack coal-fired generation. There is little if any common ground between the belligerents.
The rate of gross domestic product (GDP) growth isn’t expected to return to 2007 levels for several more years, according to the Congressional Budget Office. Worse yet, some economists are predicting a double-dip recession early in 2013, so it’s hard to imagine a quick economic rebound during the New Year. More likely, the November election results cemented another four-year energy policy vacuum, precisely what natural gas developers and federal regulators dream about—in chaos there is opportunity. All the while, a divided Congress is content to sit on the sidelines as mere spectator to the melee, abdicating its legislative responsibility for determining energy policy.
Has Washington Become Tokyo?
Early in the 1990s, the booming economy in the Land of the Rising Sun—the envy of the rest of the world throughout the 1980s—went bust. Built on a real estate bubble and government management of manufacturing and exports, Japan’s economic balloon quickly deflated and was followed by years of flat or anemic growth and entrenched unemployment. The world’s third-largest economy had an aging and dispirited population. After 20 years of economic doldrums, Japan’s economy has still not fully recovered.
Some experts, looking at the performance of the U.S. economy over the past four years, fear that the Japanese disease may have infected the U.S., although the consensus is that the U.S. has tools and talents to avoid the worst of the Japanese economic malady. How the U.S. economy in 2013 either deals with or avoids the doldrums has important implications for the way the nation uses electricity in the coming year (Figure 1).
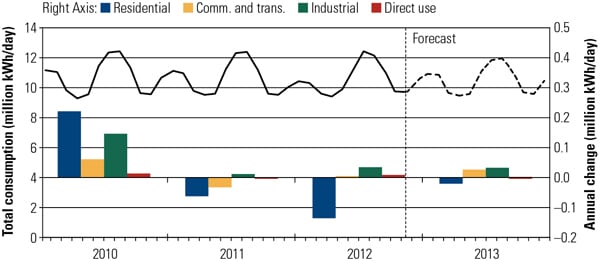 |
| 1. New normal. Residential demand dropped in 2012 while other sectors showed small gains. The increase in demand for electricity is projected to be small in 2013. According to the Energy Information Administration (EIA), “The U.S. does not return to the levels of energy demand growth experienced in the 20 years prior to the 2008–2009 recession, because of more moderate projected economic growth and population growth, coupled with increasing levels of energy efficiency.” Source: EIA, Annual Energy Outlook 2012 |
Much of the rhetoric in recent U.S. national elections, including the one just passed, hinged on competing claims of which candidate and which party could energize the economy. But history seems to demonstrate that fundamental economic forces are far stronger than political posturing and policy. That’s particularly true in the short run.
The International Monetary Fund (IMF), which has a pretty good forecasting record, predicts that 2013 will see the U.S. economy grow by a modest 2.1%. The IMF says Japan’s economy should grow by an even less-sparkling 1.2%. Says IMF Chief Economist Olivier Blanchard, “In advanced economies, growth is now too low to make a substantial dent in unemployment, and in major emerging markets, growth, which had been strong earlier, has also decreased.”
If the U.S. economy continues its current grinding path upward, rather than soaring as the politicians promised, the results for the power business are likely to be more of the same: low demand growth, little new construction, and reliance on strategies built around hedging against the future and playing it safe. That’s largely the scenario portrayed in the EIA’s Annual Energy Outlook 2012, released last summer, projecting energy demand growth from 2012 to 2035. “Overall,” says the EIA, “U.S. energy consumption grows at an average annual rate of 0.3 percent from 2010 through 2035 in the AEO2012 Reference case. The U.S. does not return to the levels of energy demand growth experienced in the 20 years prior to the 2008–2009 recession, because of more moderate projected economic growth and population growth, coupled with increasing levels of energy efficiency and rising energy prices” (Figure 2).
 |
| 2. Electricity demand rises. This chart illustrates U.S. electricity demand growth based on a three-year moving average. Electricity demand (including retail sales and direct use) growth has slowed in each decade since the 1950s, from a 9.8% annual rate of growth from 1949 to 1959 to only 0.7% per year in the first decade of the 21st century, the same as the predicted annual growth of electricity demand from 2012 through 2035, according to the EIA’s base case scenario. Source: EIA, Annual Energy Outlook 2012 |
Gas Grabs Second Place
Over the past four years, one new force has appeared in energy markets, with revolutionary results. That’s the rapid and growing impact of natural gas liberated from tight Devonian shale rock formations by horizontal well drilling and hydraulic fracturing. With prices in the range of $3/MMBtu, gas has galloped across the U.S. energy landscape with astonishing speed. According to the EIA, shale gas production in the U.S. increased from negligible amounts in 2000 to 5 trillion cubic feet (tcf), or 23% of U.S. production, by 2010. The EIA predicts that shale gas production will climb to 13.6 tcf by 2035, constituting half of total U.S. production (see “Natural Gas–Fired Plants Continue Rollercoaster Ride” in this issue).
Energy guru Daniel Yergin, founder of consulting firm IHS CERA, recently wrote, “Shale gas alone is now 10% of the overall U.S. energy supply. And similar technologies to recover so-called tight oil trapped in rock formations are largely responsible for boosting U.S. oil production by 25% since 2008—the highest growth in oil output of any country in the world over that time period.”
As EIA data demonstrate, gas has become the fuel of choice for new, central-station electric generation, while King Coal is gradually retiring from the throne. Over the past 15 years, says the Department of Energy statistical agency, most new generation has been gas or wind. The EIA notes, “In particular, efficient combined-cycle natural gas generators are competitive with coal generators over a large swath of the country. And, in the first half of 2012, these combined-cycle generators were added in states that traditionally burn mostly coal (with the exception of Idaho, which has significant hydroelectric resources).”
Illustrating its rise to royalty, gas stole second place from nuclear in the generating mix, as atomic energy in the U.S. dropped to 19% of capacity. In its September “Short-Term Energy Analysis,” the EIA reported, “The share of total generation fueled by natural gas during the first half of 2012 averaged 30.4 percent compared with 22.3 percent during the same period last year.” That was driven by gas prices that were lower than coal. Will that price differential in favor of gas continue? EIA figures are ambiguous. The statistical agency in the same report said, “However, in June, the average Henry Hub natural gas spot price surpassed the average spot price for Central Appalachian coal for the first time since October 2011, indicating that the recent trend of substituting coalâ€fired generation with naturalâ€gasâ€fired generation may be slowing and will likely reverse.”
A Question of Supply
Of course, new natural gas–fired generation depends on market dynamics five and 10 years in the future, not just in 2013. Research firm Bentek Energy in a note published in November said it expects the North American gas market to undergo unprecedented changes over the next five years. For one thing, it expects traditional supply regions in the South to become net demand regions. For another, it expects the continent’s largest demand region, the Northeast, to become a major source of supply.
Overall, Bentek expects total U.S. and Canadian natural gas production to grow by about 11 Bcf/d (14%) between 2012 and 2017. More than 80% of that growth is expected to take place in the Northeast as shale gas production from the Marcellus basin continues to grow. This surge of supply is expected to shift gas pipeline flows across the continent, provide support for power sector demand growth, and allow liquefied natural gas (LNG) exports to occur from the Northeast and Southeast regions. (As this issue was going into production the EIA published its Annual Energy Outlook 2013 Early Release Reference Case, which projects the U.S. will become a net LNG exporter “starting in 2016, as it did in the AEO2012 Reference case, and an overall net exporter of natural gas in 2020, two years earlier than in AEO2012.”)
Production growth in the Northeast is expected to far exceed that region’s demand growth over the next five years. By 2017, Bentek expects the Northeast region will be net long 5.3 Bcf/d compared to expected supply and demand in 2013. By comparison, Southeast production is expected to decline 0.9 Bcf/d between 2013 and 2017. Meanwhile, Southeast gas demand from power generation, industrial plants, the residential and commercial sector, and from LNG exports is expected to grow by more than 2.5 Bcf/d.
Bentek reports that Southeast gas demand for electric power generation has increased 130% since 2005 as power generators took advantage of falling gas prices. More than 30% of total U.S. power generation growth over the next five years is expected to take place in the Southeast. A nearly equal amount is expected in the Northeast.
Coal Leads But Is Losing Ground
During 2012, only one new coal-fired generating plant, the 800-MW Prairie State station in Illinois, came online in the U.S. According to The Brattle Group’s analysis last year, about 30 GW of coal-fired generating capacity, representing around 10% of the U.S. coal fleet, was announced for shutdown by 2016 (see “Coal Battered Early, Later Rebounds” in this issue).
The economic consultants estimated that another 59 to 75 GW of coal capacity would eventually be added to that list of retirements. Though there was considerable noise during the election campaign about the Obama administration’s putative “war on coal,” The Brattle Group analysis points to the rise of shale gas as the greatest cause of coal’s loss of power, concluding that “gas prices are a much more significant influence on retirements” than pending environmental rules. The analysis doesn’t address whether the benefits of the regulation outweigh the costs—a different, and bigger, question (Figure 3).
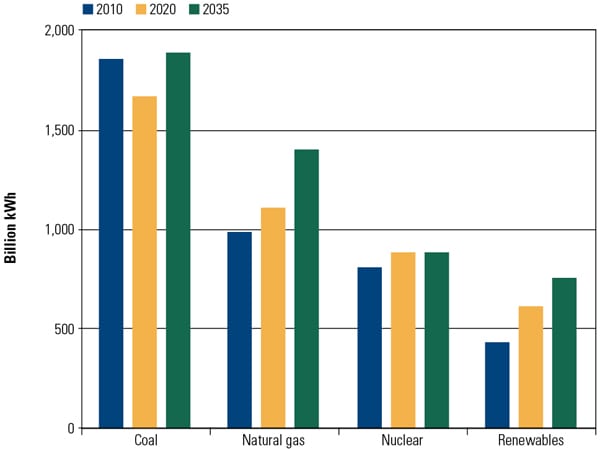 |
| 3. Coal remains king. Despite the dire predictions of coal’s demise, coal-fired plants continue to provide the largest share of electricity, and will continue to do so through 2035 (the last year of the EIA analysis). Shown is electricity generated by fuel in 2010, and projections for 2020 and 2035. Source: EIA, Annual Energy Outlook 2012 |
But the Brattle analysis does not entirely dismiss the impact of new rules on coal—and on electric reliability. The regulatory hammer could be the rule that imposes a cost on carbon dioxide emissions from power plants. Brattle’s study examined the impact of a carbon equivalent price of $30/ton hitting in 2020. That regulatory initiative, says Brattle, could mean coal plant retirements would jump from the current projection of 59 to 75 GW to 127 to 149 GW (Figure 4).
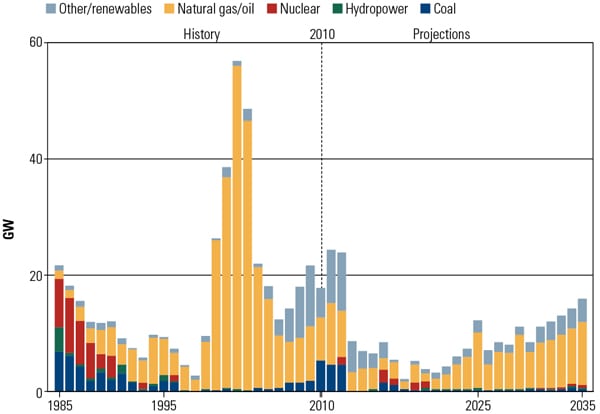 |
| 4. Down but not out. Additions to the coal fleet are small in the coming years; new generating capacity will consist mostly of natural gas–fired plants. A construction boom in the early 2000s saw capacity additions averaging 35 GW a year from 2000 to 2005, much higher than had been seen before. Since then, average annual builds have dropped to 17 GW per year. According to EIA projections, between 2011 and 2035, a total of 235 GW will be constructed, with relatively high annual additions in 2011 and 2012 of an average of 24 GW; about 40% are renewable plants. After 2012, the added capacity drops below 9 GW each year until 2025. Source: EIA, Annual Energy Outlook 2012 |
Thanks largely to natural gas, coal’s position in the mix of fuels used to generate electricity has eroded, although the losses appear to have hit bottom in 2012. In 2005, coal accounted for 50% of electric generation; it declined to 42.3% in 2011 and 37.3% in 2012. Gas generation climbed to an expected 30.6% in 2012, up from 18% in 2004. The good news for coal unit owners is that, as natural gas prices rise, coal-fired generation economics improve. In 2013, coal is expected to produce about 40.1% of the nation’s electricity.
As former Exelon CEO John Rowe famously observed, “Coal will remain King. Gas will be Queen.”
Market Ignores Nuclear
For the nuclear power industry, 2012 was a year of marginal activity, and 2013 promises to be a rerun.
Again, John Rowe, who ran the nation’s largest nuclear fleet, has a clear-headed take on the future of nuclear power. Speaking to an American Nuclear Society meeting in 2011, Rowe recalled that 20 years ago he laid out conditions necessary for nuclear renaissance. Among them, high and stable natural gas prices. Today, he said, “This condition cannot be met due to the influx of shale gas into the market. Shale is good for the country, bad for new nuclear development.”
Writing in the Winter 2012 issue of the Journal of Economic Perspectives, Lawrence Davis of the University of California, Berkeley, concluded, “In 1942, with a shoestring budget in an abandoned squash court at the University of Chicago, Enrico Fermi demonstrated that electricity could be generated using a self-sustaining nuclear reaction. Seventy years later the industry is still trying to demonstrate how this can be scaled up cheaply enough to compete with coal and natural gas.”
For nuclear power, as for every technology competing in the electric marketplace, it’s a matter of economics, said Exelon’s Rowe, and nothing else. “Nuclear needs to be looked at in the Age of Reason and not the Age of Faith,” he said. “It is a business and not a religion.”
Illustrating the economic fundamentals for nuclear, in late October, Dominion announced it would shut down its 556-MW Kewaunee unit (vintage 1973) in Wisconsin, taking a $280 million write-down. The plant was a victim of weak wholesale power prices and low natural gas prices. What had some industry observers wondering was why Dominion was unable to find a buyer for the plant.
Renewable Subsidies Set to Expire
The same observation about the primacy of economics is true for renewable energy generation, although many environmentalists and the Obama administration seem to view renewables as sacred icons. Much of the administration’s direct largess to renewables in the form of loans and grants, including large amounts of economic stimulus funds provided in 2009, unfortunately has gone into financial black holes, not green power (see table). The government has demonstrated that it is, in the words of former Obama economic advisor Lawrence Summers, “a crappy venture capitalist.”
 |
| Poor investment track record. The failing or bankrupt financial status of many renewables-related companies after receiving economic stimulus funds shows that the government did a poor job in picking marketable technologies. Taxpayers did not get their money’s worth. Source: Institute for Energy Research |
Thanks to government’s other, and thoroughly bipartisan, offerings on the green altar—in the forms of production tax credits, cash grants in advance of tax credits (the Treasury’s infamous 1603 program), and state purchase mandates and market incentives—wind and solar have held their own in the generating mix in recent years, increasing generation market share from a barely noticeable 0.5% in 2005 to a still small but growing 2.4% in 2010. Almost all of that has been wind, which grew from 0.44% to 2.3% in that period (Figure 5).
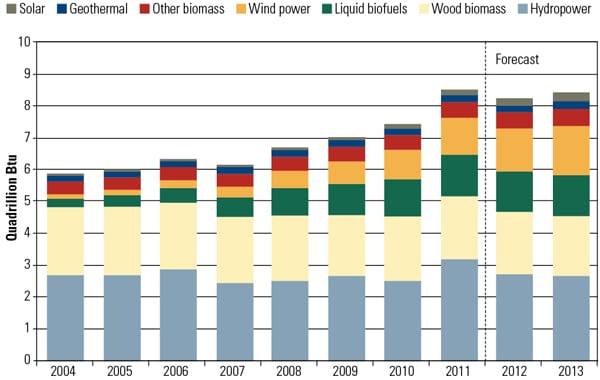 |
| 5. Stable portfolio. The amount of renewable generation available each year is most dependent on the rainfall that produces hydroelectric power. Rainfall was down in 2010 but rebounded in 2011. Average hydroelectric generation is predicted in 2013. The EIA reference case, shown in this chart, assumes the federal production tax credit expired on December 31, 2012. Source: EIA, Annual Energy Outlook 2012 |
According to the American Wind Energy Association (AWEA), the lobbying group for wind power, wind installations in 2012 were on pace to almost match 2011’s performance, when 6,816 MW of new nameplate capacity went online. For the first half of 2012, said AWEA, 2,869 MW of wind went online. By contrast, the wind industry put up 10,000 MW of new capacity in 2009. AWEA’s figures show that another 10,312 MW of wind was in the construction pipeline at mid-year 2012, attempting to get built before production tax credits expired at the end of 2012.
Not all of the wind projects AWEA lists as under construction are likely to be completed. A recent headline in the Yakima Herald-Republic in eastern Washington, where wind has been a booming business, captures the prospects for wind in the year ahead: “Economic uncertainty puts the brakes on Northwest wind power industry.” The article notes that at least seven wind projects are “up in the air” in Kittias and Klickitat Counties, facing a shortage of electric transmission to markets in California and competition from low-cost natural gas.
The wind industry began a strong lobbying campaign in mid-2012 aimed at restoring the production tax credit. AWEA has been working with the Boston-based advocacy group Ceres to push the production credit. Ceres last fall arranged for a business group, Business for Innovative Climate and Energy Policy, to write congressional leaders urging extension of the tax credit. That effort failed, but wind supporters hope to bring the topic up again during the coming debate over federal fiscal and tax policy. Given Republican opposition to subsidies for renewable energy, the prospects for extending the production tax credit appear slim (see “Grading My 2012 Industry Projections,” a web exclusive associated with this issue). The 30% investment tax credit for wind projects also died on December 31.
Even if Congress were to restore the wind subsidies for another year, that might not have an impact in 2013. According to George Nall, an executive with wind turbine maker Gamesa Energy USA, it takes at least 12 months for a new project to move from planning to construction, so another year of the tax credit won’t help projects that aren’t already in the pipeline.
For solar, the market for photovoltaic (PV) panels largely collapsed in 2012 amid a worldwide glut; there is nothing on the horizon to suggest a turnaround, according to the Solar Buzz market research firm. That’s good news for consumers who want to equip their homes with sun power, and those who install the panels, but bad news for companies making panels. A market shakeout, already under way, is likely to accelerate. Last fall, GTM Research predicted that 180 solar panel manufacturers around the world are likely to vanish by 2015, with 88 of those in the U.S., Europe, and Canada. By the end of 2013, cell and panel manufacturing in the U.S. could disappear completely.
As an indication of the weakness of the PV market, in mid-October, Satcon, a large manufacturer of solar inverters, filed for Chapter 11 bankruptcy protection, citing $93 million in assets and $121 million in debt. Its stock was trading at under a dime a share. Greentech Media Editor-in-Chief Eric Wesoff commented, “Clearly troubles in solar are not limited to module suppliers or thin-film CIGS startups.”
While the PV business was getting clobbered, 2012 was a solid year for utility-scale solar, still tiny by any measure. That market may continue to remain healthy in 2013, driven by state renewable energy purchase mandates. According to the Solar Energy Industries Association (SEIA), the Washington lobby for the solar business, the second quarter of 2012 saw a record 477 MW of utility solar capacity come into service. Utility solar represented well over half of the total of 742 MW of solar capacity added in the second quarter. “More solar was installed in the U.S. this quarter than in all of 2009, led for the first time by record-setting utility-scale projects,” said SEIA President and CEO Rhone Resch.
Solar technologies have seen a dramatic reduction in costs, notes investment banker Stuart Bernstein of Goldman Sachs. Once in the range of $90/W, solar is now available at $1/W (PV panels only). That, he predicts, will drive the solar market around the globe in the years ahead. But solar in 2013 will remain a barely perceptible portion of the U.S. electric generating mix, according to the EIA.
Texas Market Reform
A region worth watching in 2013 is Texas, where regulators are working to adjust market mechanisms to entice new generation capacity additions to meet demand in what is perhaps the country’s most economically robust region. Rising petroleum production not only is driving refinery expansions but also fueling chemical plant expansions and exports. Calpine said that load growth in Texas is “north of 3%” a year and that more than three dozen new commercial high-rises are planned for Texas, plus an expansion for the Port of Houston.
Although Texas is reaching a point where new investment in generation is required to protect electric reliability, the needed investment to meet this demand has not yet begun to materialize. Independent power producer (IPP) Calpine said in November that 2015 on-peak spark spreads were sufficient to support investment at $500 to $600/kW. But the state’s grid, ERCOT, needs new investment that is expected to cost around $1,000/kW at full replacement cost. Consequently, a gap exists between where forward prices are currently trading (at the $500 to $600/kW level) and where they need to be to incentivize new investment. Rational, economic investors would not invest at full replacement cost based simply upon today’s forward energy curves, the IPP said. “In Texas, this is called the ‘missing money’ problem,” said Thad Hill, Calpine’s executive vice president and chief operating officer. “There are overwhelming indicators that the market must change.”
Texas regulators have been working to raise systemwide offer caps in an effort to incentivize new generation development. The systemwide offer cap was raised on August 1 from $3,000 to $4,500/MWh. Regulators approved a further price cap increase in late October, to $9,000/MWh by 2015.
Besides raising the price caps, Texas regulators will focus their attention this year on market reform proposals to further encourage new generation. One option under consideration is a forward capacity market similar to PJM, but with some Texas twists. For example, there would be a single zone, and there would be no need for a minimum offer price rule. An analysis by The Brattle Group said the three-year forward period contemplated by the proposal would be sufficient to include new builds in the supply curve without creating risks of long-term forward commitments.
Brattle also pointed to several risks with the proposal. First, the firm said it suspects that investors will start responding right away in anticipation of a capacity payment upon delivery. The danger in setting a 2015/16 price floor in early 2013 is that it will strongly mitigate the risk of capacity shortfall in 2015. Second, multiple administrative rules would need to be created related to load forecast, reserve margin requirement, demand curve shape, and resource adequacy qualification rules. Ongoing litigation over parameters and rules can create market uncertainty, the consultants said. Third, sticker shock could result and lead consumers to blame the new capacity product. This could be mitigated somewhat by high load growth and a three-year forward period, which likely would produce what economists refer to as an elastic supply curve. Sticker shock also could be eased by demand response programs, which would be allowed to enter and exit at a range of prices.
A second market reform option under consideration by regulators is an energy-only market in which price caps are raised, reserve requirements are raised, and demand response is implemented. A concern is whether or not sufficient demand response growth will occur to maintain the target reserve margin. The Brattle Group said that by 2015, a significant shortfall could occur relative to the current 13.75% reserve margin target. By 2016 and beyond, more than 3,500 MW of additional demand response may be needed in ERCOT to meet the target.
The European Outlook
Europe had another interesting year in 2012. As economic woes continue to squeeze the 27 European Union (EU) states (Greece, Spain, and Italy in particular), the future of the single currency is rarely out of the news, and half a century of political union is under real strain. In Germany, the engine of Europe’s manufacturing economy, 1/10th of all adults are reported to be unable to pay all their bills. Half of all British people would vote to leave the EU, a recent poll found.
Europe’s generally high energy costs might be eased by the planned single internal energy market, not due until 2014, despite the fact that other services, goods, and labor have flowed freely within the EU for 25 years. The European Commission recently let slip, however, that it is unhappy with progress toward the single energy market: Subsidies are too dominant in investment decisions, the generating market in many countries is still highly concentrated, and new entrants struggle to access the transmission grid.
Still, the Commission is standing firm on its “20-20-20” targets for 2020: compared to 1990 levels, a 20% improvement in energy efficiency and a 20% cut in CO2 emissions, plus 20% of total energy supply (generally taken to mean 30% of electricity generation) from renewables. Falling energy demand during the recession has cut the annual cost of the 20-20-20 plan to €48 billion (0.32% of Europe’s GDP in 2020), the Commission says, compared to €70 billion previously.
As a result, the EU is now wondering whether to raise the 2020 carbon target from 20% to 30% if it signs up to Kyoto 2 at the UN COP-18 climate change summit in Doha, Qatar, at the end of November. This would cost rather more—€80 billion a year (0.54% of GDP)—but would take Europe closer to its target of 95% decarbonization by 2050.
Coal Upsets the Carbon Cart
Although progress toward the 20-20-20 targets has been on track so far, a renaissance of coal in power generation will offset some of the carbon cuts gained through Europe’s heavy investment in wind and solar power. (See “THE BIG PICTURE: The Coal Pile,” p. 10 in this issue, which shows three European nations among the top 10 countries with proposed coal capacity.) In September, Swiss bank UBS AG forecast that seven European countries will build 10 GW of new coal plants in the next four years, compared to 1.6 GW of gas-fired capacity.
The favorable economics of coal compared to gas have been aided by a slump in carbon permit prices to below €10 per metric ton (mt) under the pioneering European Emissions Trading Scheme (ETS). Rather than letting the carbon market take its course, however, the Commission wants to boost prices by delaying some of the permits due to be auctioned in the 2013–2020 trading round of the ETS, scheduled to begin in January. Arguments continue over whether the Commission has the legal authority to do this. In any case, raising the carbon price to €40 to €50/mt—a level that might stem the dash for coal—would almost certainly require the quota of permits to be cut rather than simply delayed.
The fall in the carbon permit price has also hurt plans for carbon capture and storage (CCS), because the ETS is supposed to provide a large chunk of the EU’s budget for demonstration projects. With CCS driven by the climate agenda rather than enhanced oil recovery, Europe has fallen behind the U.S. on this front. At the moment the credible coal CCS projects remaining in the EU are Don Valley (UK), ROAD and Green Hydrogen (Netherlands), and Getica (Romania), while the UK’s Peterhead project is a leader in CCS for natural gas.
Coal is also behind the collapse in October of the EU’s planning talks in the run-up to the Doha summit, and a potential east-west split. Poland, which depends heavily on coal, says it has met its CO2 reduction targets and so should be allowed to keep spare emissions permits from the quota assigned to former Communist countries under the original Kyoto Protocol. Poland gained support from seven other east European and Baltic states, and the EU’s Doha proposals have been watered down accordingly.
Germany Feels the Squeeze
Enthusiasm for coal is not confined to eastern Europe. Germany gets more than 40% of its power from coal and is planning several new coal-fired plants to help fill the gap left by closing over 12 GW of nuclear capacity.
Germany’s nuclear exit, though rapid, was not as careless as some commentators have assumed. There was always a plan to make up the shortfall through renewables and to decarbonize the energy system completely by 2050. This has worked well in the sense that wind, solar PV, and biomass now provide 25% of Germany’s electricity.
But the transformation has not come cheaply: Costs associated with renewable energy now account for around 20% of German household electricity bills, and the proportion is rising. Against this, the German Institute for Economic Research points out that renewables, with their zero fuel cost, are already reducing inflation in wholesale power costs.
With or without renewables, however, German power is expensive (consumers pay €0.25/kWh and industry around half that). EU Energy Commissioner Günther Oettinger, a member of Chancellor Angela Merkel’s ruling CDU party, has spoken of “runaway power prices” and fears that decarbonization could lead to de-industrialization. CDU Environment Minister Peter Altmaier recently said that he was skeptical about parts of Germany’s “energy transformation.”
The rapid growth in renewables has brought technical issues too, such as the difficulty of connecting wind farms in the north of the country with industry in the south. Neighboring countries, including the Czech Republic and Poland, are complaining that high levels of German wind power put their grids under strain.
Energy minister Altmaier has admitted Germany’s lack of consultation with its neighbors during the transition period. He suggested future cooperation based on the Nordic model where, for instance, Denmark exports surplus wind power to Norway and imports Norwegian hydro power when wind speeds are low.
European Nuclear Divisions Reinforced
Progress toward a single energy market and the spread of transmission grids across national borders highlight the sharp differences between the nuclear policies of different European nations.
The Czechs, for instance, frustrated at what they see as unfair use of their national grid to transport German power, are getting their own back by planning two new reactors at the existing Temelín nuclear plant in Bohemia. The site is just 70 kilometers from the borders of both Germany and (non-nuclear) Austria, and protesters from both countries joined Czechs opposed to completion of the original two modified Soviet VVER reactors in 2000–2002. With Germany now nuclear-free, the Temelín expansion plan looks set to cause deep divisions.
Even France looks poised to reduce its dependence on nuclear power from 75% to 50% following the election of Socialist President François Hollande in 2012. Environment and Energy Minister Delphine Batho is currently gathering information and opinion with a view to launching a new national energy policy in 2013.
The UK, meanwhile, would like more nuclear plants to replace its aging fleet, though it has had a hard time finding anyone willing to build them. France’s EDF put on hold its plan to build a new reactor at the Hinkley Point site in southwest England, and although the firm says it remains committed to the project, a decline in French enthusiasm for nuclear power could yield a different result.
As seemed likely a year ago, Germany’s RWE and E.ON decided not to go ahead with UK nuclear projects at Wylfa (north Wales) and Oldbury-on-Severn (western England). In November the firms sold their stake to Hitachi, which will build two or three of its Generation III+ Advanced Boiling Water Reactors in collaboration with Babcock International and Rolls-Royce.
A stable, low-risk investment climate is as important to nuclear as it is to wind projects, so to get its nuclear new build, the British government has had to pay up. As POWER went to press, a new UK energy bill was believed to be within days of publication to parliament, having first seen the light of day in May 2012 as a draft. Pillars of the new energy bill are “contracts for difference”—subsidies for nuclear and other low-carbon generation technologies—and a capacity market that will reward investment in gas-fired plants as a backup to intermittent renewables. Critic Dieter Helm, professor of energy policy at Oxford University, says the proposals are too complex, bureaucratic, and top-down.
One type of nuclear construction seems a sure thing. In October, it emerged that necessary safety upgrades to the EU’s 132 nuclear reactors are likely to cost €10 billion to €25 billion. The upgrades are required following stringent “stress tests” in the wake of the Fukushima nuclear accident.
Europe Still Waits for Cheap Gas
European industrial gas prices in the range of €0.03 to 0.06/kWh (equivalent) and lower wholesale power prices as a result of the recession have cut margins for older gas plants and led to the mothballing or closure of several comparatively modern combined cycle gas turbine plants. In the medium term this situation could change if cheaper gas arrives by pipeline from the Caucasus and central Asia, as LNG from the U.S., or in the form of European shale gas.
Poland still aims to be the European shale gas leader, though its reserves estimates fell by around 90% in the past year. The UK too continues to look promising, though commercial extraction is not expected to start for another five years. France has significant reserves but maintains its opposition to shale gas. In September, the Netherlands delayed a decision on shale gas until 2013 because the necessary risk assessment was taking longer than expected.
In September, a trio of studies by the European Commission found that, compared to conventional gas, extraction of shale gas generally has a larger environmental footprint. It also generates more greenhouse gas emissions than domestic conventional gas, the study said, but could be less environmentally damaging than long-distance gas imports by pipeline or as LNG.
Although German operators such as RWE stress the ability of new coal-fired plants to respond quickly to varying production from wind and solar plants, it is, of course, gas turbines that have traditionally been seen as the natural partners of intermittent renewables. Worried about Europe’s falling use of gas for generation, Shell has joined forces with Danish offshore wind specialist Dong Energy, GE, Alpine Energie, and First Solar to create a lobbying group known as the Energy Partnership, described as “the European coalition for renewable energy and gas.”
Optimism Amid Turbulence for European Renewables
As 2020 approaches, some observers believe that the EU’s 20% renewables target should not be replaced, and that further decarbonization should be driven purely by setting limits on CO2 emissions. At the launch of the Energy Partnership on October 31, however, Commissioner Oettinger said he supported a binding target for the percentage of renewable energy by 2030.
In solar PV, Europe gained 18.5 GW of capacity in 2011—two-thirds of the global total of new installations, according to the EU’s Joint Research Centre. The largest gains were in Germany and Italy.
A group of manufacturers calling themselves EU ProSun have complained that China is dumping cheap solar panels onto Europe, prompting a Commission inquiry that may lead Europe to impose import duties, as the U.S. has done. But, again mirroring the U.S. experience, representatives from a counter-coalition representing the wider European solar industry, the Alliance for Affordable Solar Energy, say that free trade has helped to create 300,000 European jobs that would be put at risk by a trade war.
At the end of September, the European Wind Energy Association (EWEA) announced that the EU had passed the 100-GW milestone for installed wind power capacity, though high costs, permitting delays, and shortage of transmission capacity were delaying progress on large offshore wind projects.
Danish wind turbine manufacturer Vestas had a terrible year in 2012, losing its entire board, with the exception of embattled CEO Ditlev Engel. Now the Danish firm is seeking a 20% equity investment; Mitsubishi has been mentioned after previous rumors of a Chinese buyer evaporated. Long the biggest name offshore, Vestas has now lost its lead to Siemens, which, according to Bloomberg New Energy Finance, was set to account for about 57% of Europe’s 4.5 GW of offshore wind capacity by year-end 2012.
Following an initiative originally kicked off by UK Prime Minister David Cameron, Vestas, Siemens, and 42 other companies have joined Norstec, an alliance to cut the cost of offshore wind power. The British government wants to see a cost of £100/MWh ($161/MWh) by 2020; according to Bloomberg New Energy Finance, the present cost is around $226/MWh, compared to $85 for onshore wind, $82 for coal, and $71 for natural gas.
And there it is again—natural gas with the price to beat.
— Dr. Robert Peltier, PE is editor-in-chief, David Wagman is executive editor, Kennedy Maize is a contributing editor, and Charles Butcher is European reporter for POWER.