There are many reasons for utilities to invest in Advanced Distribution Management Systems, particularly as more renewable resources are utilized and integrated, and the need for reliability and resilience of the power grid grows.
According to Gartner’s IT Glossary, an Advanced Distribution Management System (ADMS) is “the software platform that supports the full suite of distribution management and optimization. An ADMS includes functions that automate outage restoration and optimize the performance of the distribution grid. ADMS functions being developed for electric utilities include fault location, isolation and restoration; volt/volt-ampere reactive [Var] optimization; conservation through voltage reduction; peak demand management; and support for microgrids and electric vehicles.”
Another way to look at an ADMS is to consider its capabilities. The following are 10 attributes of an advanced distribution automation capability, based on an Electric Power Research Institute Information and Communication Technology program definition:
- Real-time distribution operation model and analysis (DOMA)
- Fault location, isolation, and service restoration (FLISR/FDIR)
- Voltage/Var control (VVC/VVO)
- Distribution contingency analysis (DCA)
- Multi-level feeder reconfiguration (MFR)
- Relay protection re-coordination (RPRC)
- Pre-arming of remedial action schemes (PRAS)
- Coordination of emergency actions (CEmA)
- Coordination of restorative actions (CRA)
- Intelligent alarm processing (IAP)
A 2017 Newton-Evans study of energy management system, supervisory control and data acquisition (SCADA) system, DMS, and other control system usage patterns found that 46% of North American electric utilities surveyed had either already implemented or planned to implement an ADMS by 2019. The majority of investor-owned utilities surveyed (65%) had an ADMS or planned to have one by year-end 2019. ADMS suppliers among the survey participants included ABB, ACS Power, GE, OSI, Schneider Electric, and Survalent. Forty-four percent of respondents indicated their three-year budgets for ADMSs were less than $500,000 over the 2017–2019 period, though three large investor-owned utilities anticipated spending more than $2 million for ADMSs during that time.
Reasons for ADMSs
There are many reasons to invest in ADMS integration. The U.S. Department of Energy’s “Voices of Experience: Insights into Advanced Distribution Management Systems” explains the rationale for adopting an ADMS by outlining four business case drivers. They are:
- Resilience. The ability to withstand or recover from a natural disaster quickly.
- Renewables. The ability to accommodate larger quantities of distributed energy resources.
- Replacement. The ability to supplement legacy systems that are unable to integrate with new technologies and that staff can no longer support.
- Regulation. The ability to accommodate changes that encourage reliability and efficiency.
The current proliferation of distributed sources of energy such as solar and wind is an important reason to consider adopting an ADMS. Of those surveyed by Newton-Evans who were current or potential ADMS users, 63% said they were planning to include distributed energy resources (DERs) in their ADMS’s functionality, anticipating the expansion and eventual interconnection of DERs and various forms of energy storage with existing grid systems.
When asked, “What applications do you use as part of your DMS or ADMS?”, more than half of utilities surveyed by Newton-Evans indicated “real time network visibility” and FLISR were in use or planned for use on their distribution network by 2019 (Figure 1). Distribution network optimization methods such as Volt/Var Optimization and Conservation Voltage Reduction were also in use or being considered by 44% of utilities, and 42% said DER management was an application of interest.
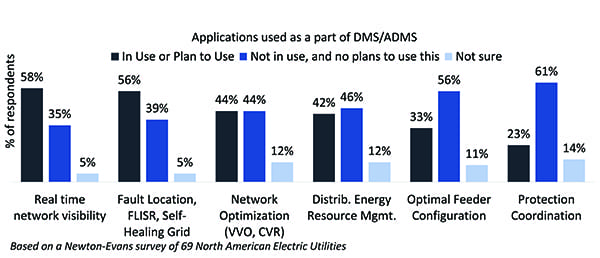 |
|
1. Applications used as a part of distribution management systems (DMSs) or advanced distribution management systems (ADMSs). Courtesy: Newton-Evans Research Co. |
Current Levels of Automation
An important factor in assessing the market for ADMSs is estimating the amount of distribution feeder automation already in place. The 2018 Distribution Automation Market survey sample represented a total of 52,562 distribution feeders in operation in the U.S. and Canada (see sidebar). The majority of these feeders (85%) were assets owned and operated by large investor-owned utilities. Based on an estimate of 225,000 medium-voltage (MV) distribution feeders in operation across North America, at an average of four feeders per MV substation, that would provide a 23% sample for the study.
|
Market Studies The figures and observations presented in this article are based on the completion of two major market studies on electric power distribution automation and control conducted by Newton-Evans Research Co.: “North American Distribution Automation Market Assessment & Outlook 2018–2020,” and “The World Market Study of SCADA, EMS, DMS and OMS in Electric Utilities: 2017–2019 Volume 1: North American Market.” |
Utilities were asked, “Approximately what percentage of all your feeders have SCADA-controlled sectionalizing switches installed with operation that is A) manual B) semi-automatic or C) fully automatic?” This question also measured “of those feeders that do have SCADA-controlled sectionalizers, what percent are fully/semi-automated?” Semi-automatic operation was defined as “upstream restoration is automatic and downstream restoration is manual,” while fully automatic meant both upstream and downstream restoration were automatic.
The overall sample indicated that only 18% of feeders equipped with SCADA-controlled sectionalizers were capable of fully automatic sectionalizing, while the bulk of the sectionalizer-equipped feeders were only capable of manual switch operation. As is often the case, though, companies serving more end-users tended to be more automated; large utilities in the survey indicated an average of 63% of their feeders with SCADA-controlled sectionalizers had fully automated restoration upstream and downstream.
Utilities were then asked, “Approximately what percentage of all your feeders have or will have Fault Detection Isolation Restoration (FDIR) or Fault Location Isolation Service Restoration (FLISR)?” Overall, survey respondents indicated that an average of 11% of feeders in the sample had FDIR/FLISR, while an additional 8% will have FDIR/FLISR by year-end 2020. Investor-owned utilities reported that 20% of their feeders had FLISR, with an additional 12% being upgraded by 2020. Large utilities (with ≥500,000 customers) reported that 25% of their feeders had FLISR, and an additional 17% would also have FLISR by 2020.
Volt/Var Optimization
As mentioned above, Volt/Var optimization is a key ADMS function in addition to FLISR and outage-related functions. When asked, “Approximately what percentage of all your feeders have or will have Volt Var control (VVC), Volt Var Optimization (VVO), or Conservation Voltage Reduction (CVR)?”, the survey sample indicated that an average of 33% of distribution feeders had either VVC, VVO, or CVR. The percentage of VVC/VVO/CVR-equipped feeders was higher among investor-owned utilities and larger utilities serving more than 100,000 customers. Overall, one in five utilities indicated that 90% or more of their feeders used Volt/Var control or optimization. However, 37% of utilities surveyed claimed that none of their feeders were set up to use VVC/VVO.
Cost savings—and not necessarily regulatory compliance—seemed to be the main driver for using Volt/Var optimization. Thirty-nine percent of respondents indicated “cost savings by reducing the need for infrastructure enhancements” was a deciding factor, and 25% said “Cost savings by reducing the need for additional generation [such as peaker plants]” was a factor (Figure 2). Many of the written responses provided as an “other” reason also mentioned cost savings related to reducing peak demand and line/system losses. Cost savings came from demand response; reduced system losses; by reducing contract demand; demand charge from power provider; wholesale power costs; and a reduction in purchased power. The rationales for using VVO identified in the 2018 survey sample were similar to those reported in a 2014 sample.
 |
|
2. Rationale for using Volt/Var Optimization (VVO). Courtesy: Newton-Evans Research Co. |
Device Controls and Communication
Increased automation of distribution feeders can facilitate a utility’s migration toward an ADMS by putting newer hardware and device controls in place for the ADMS software to manage. The 2018 Distribution Automation Market study findings suggest the likelihood that more utilities are indeed automating their distribution feeders; less than half (46%) of respondents said they do not have feeder automation, compared to 58% in 2014 who said they didn’t have feeder automation. Additionally, 31% of respondents in the 2018 survey reported the control logic for FLISR is in the SCADA control center, and 25% cited FLISR control logic resides in field locations.
Large utilities serving more than 500,000 customers and investor-owned utilities had FLISR logic in the control center to a greater extent than did public power or cooperative utilities. Five respondents said they had FLISR control logic in more than one place, such as in the substation and the control center, or substation/control center/in the field.
Twenty-three percent of respondents reported that they had integrated some communication links or controls for distributed generation (DG) into their distribution automation (DA) system architecture. This was slightly higher than what was observed in an earlier survey, which had found that 16% of the utilities surveyed were doing this. A larger portion of investor-owned utilities and utilities serving more than 100,000 customers were integrating DG communications as of mid-2018 than was found in the overall sample.
Utilities were asked, “Are you considering a trial deployment to manage distributed energy resources—DERs [such as inverters, energy storage, electric vehicle chargers, etc.]—within the DA system?” Twenty-five percent of respondents indicated they were considering a trial deployment of DER management within the scope of their utility DA activities and plans. This was slightly higher than what was observed in the 2014 survey (15%). Twenty-four percent of participants in the 2018 survey indicated they planned a trial deployment to manage DERs.
A Growing Market
ADMS and SCADA/DMS technologies will assuredly play an increasingly important role as field-based DA investments continue to grow. There will likely be an increasingly complex array of field devices to monitor and control.
The total North American DMS market is made up of ADMS and distribution SCADA systems, with some overlapping providers and some different market participants in each category. The combined development of smart DA field devices, associated controls, and software as developed for ADMS and SCADA/DMS systems provides a DA market in the U.S. alone for National Electrical Manufacturers Association members that is approaching $1 billion currently, and adding in the costs for dedicated communications equipment and services, the amount reaches $1.3 billion, and will likely exceed $2 billion by 2021.
This market will continue to show strong growth through at least 2024, when Newton-Evans expects U.S. DA-related shipment values of about $2.5 billion. Canada will add another several hundred million to this total. Globally, the DA-related market values are likely to exceed $6.5 billion by 2024. ■
—Eric Leivo is a senior associate with Newton-Evans Research Co., which conducts survey research and studies focused on energy industry automation, information technology, and infrastructure such as Smart Grid and grid modernization.