According to the Occupational Safety and Health Administration, 22 million people—including nearly all power plant workers—are exposed to potentially damaging noise at work each year in the U.S. Hearing conservation programs strive to prevent hearing loss and equip workers with the knowledge to safeguard themselves. Understanding the basics of sound and noise propagation could help engineers evaluate areas and identify methods to further reduce exposure.
Sound and noise propagation evaluation is a complex and specialized subject. It is encountered to some degree in all types of industrial, commercial, residential, and transit systems. This article provides some fundamental information for readers who are unfamiliar with sound and noise propagation. It includes some of the terminology and basic equations used in noise propagation studies.
Decibels and Sound Levels
The basic unit used in noise analysis is decibel (dB), which is a measure of the sound level (Figure 1). The sound level could be the sound power level, sound pressure level, or sound vibration level.
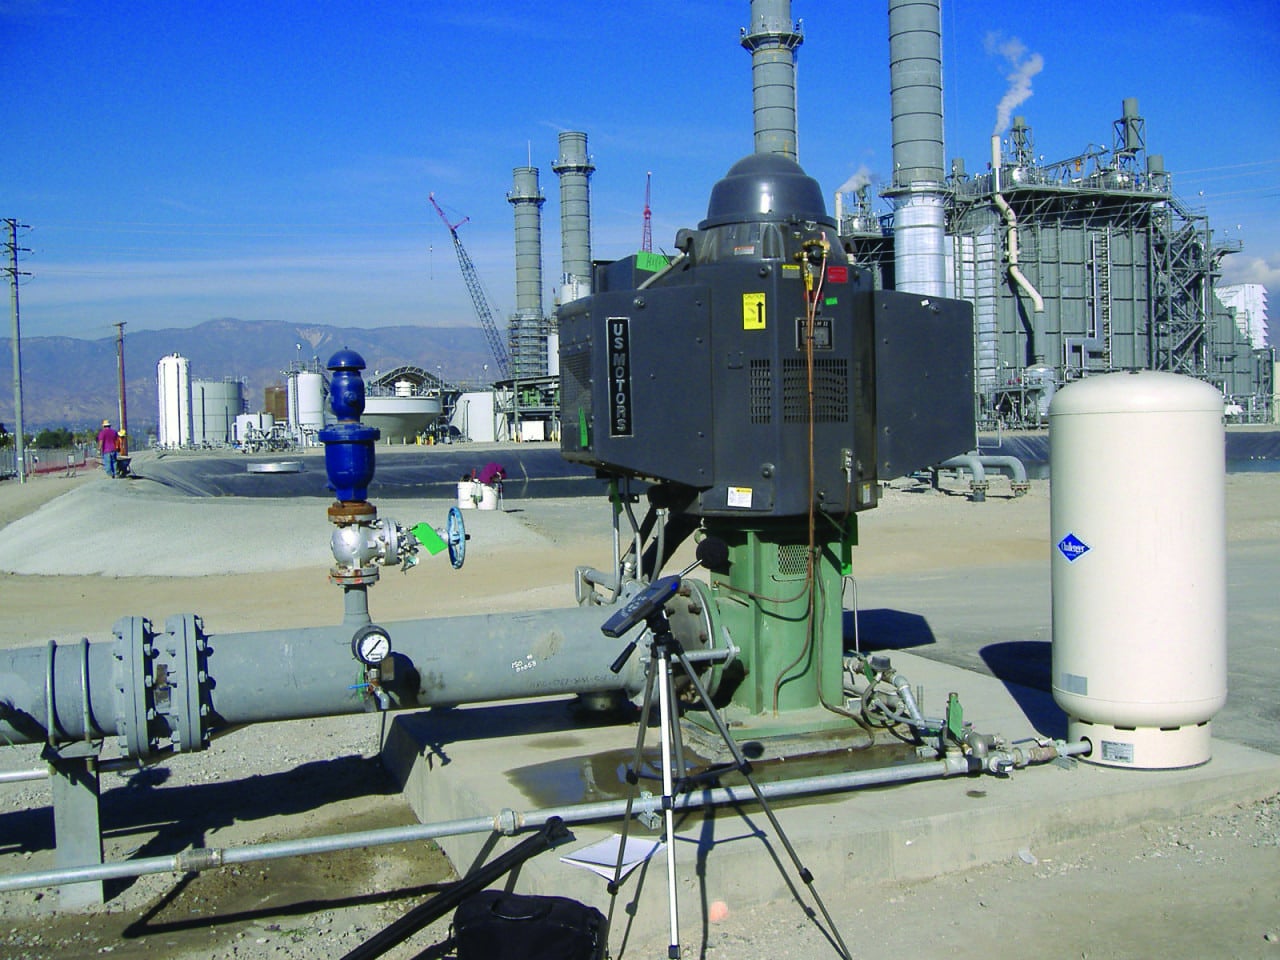 |
| 1. Sound monitoring surveys. A tripod-mounted noise meter is shown in the foreground of this image measuring noise from a pump motor. Courtesy: Bechtel Corp. |
The sound power level (PWL) is the amount of energy generated from a sound source similar to the wattage of a light bulb. The sound power level (in dB) is the sound power in watts relative to the sound power reference base of 10–12 watts. The decibel is a ratio (somewhat similar to percent), and in the case of sound power level is equal to 10 times the log of the sound power level ratio. The equation, found in chapter 8 of the 2017 ASHRAE Handbook: Fundamentals, I-P Edition, is:
PWL (in dB) = 10 log (P1 / Pref)
where P1 / Pref is the ratio of the sound power level and Pref is the reference base of 10–12 watts. The advantage of using decibels is that a very large change ratio of P1 / Pref can be reduced to a small number because log (P1 / Pref) is small.
Sound pressure level (SPL) is the pressure generated by sound waves as they strike the human ear. It is affected by distance from the sound source. The sound pressure level (in dB) is equal to 10 times the log of the square of the sound pressure ratio. The equation, also found in the 2017 ASHRAE handbook, is:
SPL (in dB) = 10 log (P1 / Pref)2
or
SPL (in dB) = 20 log (P1 / Pref)
where P1 / Pref is the ratio of the sound pressure level with P1 as the effective root mean square (rms) sound pressure and Pref is the reference pressure of 20 micropascals (20 µPa). This reference is used because it is the lowest sound pressure which can be heard by a young, healthy human ear in the maximum hearing sensitivity of about 1,000 Hz.
Addition of Decibels
Decibels are logarithmic quantities. Therefore, they must be added logarithmically rather than algebraically. The 2017 ASHRAE handbook provides the following equation:
dBsum = 10 log (10L1/10 + 10L2/10 + 10L3/10 + … )
where L1, L2, and L3 are the dB values from several sources. For example, when two sources of 70 dB each are added, the result will be:
dBsum = 10 log (107 + 107) = 73 dB
Based on the equation above, additional calculations can be performed to obtain the results shown in Table 1 when summation of two noise sources of different values is considered. Similarly, for decibel subtraction, if there are two sources producing 73 dB and if one source of 70 dB is removed, the result would be:
dBsum = 10 log (107.3 – 107) = 70 dB
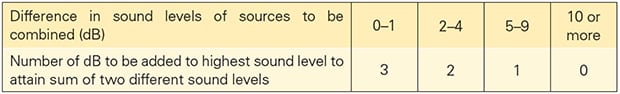 |
| Table 1. Summing different sound levels. This table shows the number of decibels (dB) to be added to the highest sound level when two different sound levels are combined. Source: 2017 ASHRAE Handbook: Fundamentals, I-P Edition |
Understanding Noise and Sound
The following are some terms frequently used by sound experts and brief explanations of what they mean.
Octave Frequency Bands. Noise from a typical industrial piece of equipment is measured with an octave band analyzer, which provides noise values over the full frequency range of human hearing. An octave band represents a frequency range in which the higher frequency is two times the lower frequency. Thus, the octave band center frequency of 31.5 is bounded in the octave band with lower frequency of 22 Hz and higher frequency of 44 Hz.
For finer resolution, the octave band can be divided into three, one-third octave bands. The one-third octave band is the frequency band in which the upper frequency is equal to the lower frequency multiplied by the cube root of two. The corresponding octave band level can be determined by the summation of the three one-third octave band levels using the equation for summation given above.
A-Weighting of Sound Level. The human ear is more responsive to frequencies in the range of 500 Hz and 8 kHz, and it effectively cuts off the lower and higher frequencies. The A-weighting accounts for the response of the human ear and the sound levels in dB can be converted to dBA by applying the frequency weighting A-corrections shown in Table 2.
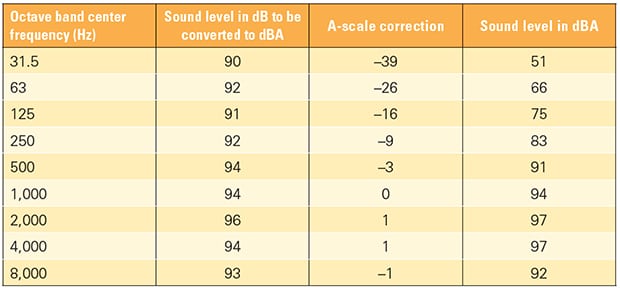 |
| Table 2. A-weighting. The human ear is more responsive to frequencies in the range of 500 Hz to 8,000 Hz. The A-weighting accounts for the response of the human ear. Source: 2017 ASHRAE Handbook: Fundamentals, I-P Edition |
The A-weighted overall sound level is then computed by combining the values given in the last column of Table 2 as follows:
dBAsum = 10 log (1051/10 + 1066/10 + 1075/10 + 1083/10 + 1091/10 + 1094/10 + 1097/10 + 1097/10 + 1092/10) = 101.9 dBA
Equivalent Continuous Level of Noise. Equivalent continuous level of noise (LAeq) is defined as the equivalent continuous A-weighted sound level when the sound is varying over time. This can be considered as a type of average. For example, let’s consider a worker who is subjected to different noise levels in various areas of a plant for varying times. If during the course of an eight-hour workday the person spent one hour in an area with an 80-dB noise level, four hours in an area with an 85-dB noise level, and three hours in an area with a 70-dB noise level, the LAeq would be calculated using the following equation courtesy of Pacific Ears Pty. Ltd.’s noise exposure calculator:
LAeq = 10 log [(1/8) x (1 x 1080/10 + 4 x 1085/10 + 3 x 1070/10)] = 82.4 dB
Sound from Point, Line, and Plane Sources. Sound from a point source radiates energy uniformly in all directions in a spherical manner, such as noise emanating from an airplane. Sound from a line source radiates energy in a cylindrical pattern, such as noise from a train; highway; or heating, ventilation, and air conditioning (HVAC) ducting. Sound from a plane source radiates energy from a plane into a space, such as noise transmission through a wall.
PWL is not dependent on distance from the sound power source, whereas SPL is directly dependent on the distance from the source. In other words, PWL is the “cause” and SPL is the “effect.” This “effect” continues to diminish as the distance from the sound power source increases. The following equations, found in McQuay Air Conditioning Application Guide AG 31-010, HVAC Acoustic Fundamentals, can be used to convert PWL to SPL.
For a point source of noise:
SPL = PWL + 10 log [Q / (4πd2)] + k
where Q is the directivity factor (Q = 1 for a point source in full spherical space, such as an airplane flying in the air), d is the distance from the sound power source (in meters), and k is a constant with the value of 0.5 for SI units or 10.5 for IP units.
For a line source of noise:
SPL = PWL + 10 log [Q / (πdL)] + k
where L is the length of the sound source (in meters).
For a plane source of noise when d < b / π (for other values of d, this equation is slightly modified):
SPL = PWL + 10 log [π / (4bc)] + k
where b is the shorter wall dimension (in meters) and c is the larger wall dimension (in meters).
For a point source radiating sound energy in a confined space such as a room:
SPL = PWL + 10 log [Q / (4πd2) + (4 / R)] + k
where R is a room constant. The following equation is used to calculate R:
R = (ST x α) / (1 – α)
where ST is the total area in the receiving room and a is the average sound absorption coefficient in the receiving room. The term 4 / R represents the reverberant field generated by sound reflections from room surfaces. The value of Q could be 1, 2, 4, or 8, depending on structures surrounding the sound power source.
Geometric Spreading of Sound Energy. The geometric spreading of sound energy occurs due to the expansion of sound wave fronts. The geometric spreading could be spherical or cylindrical spreading. Spherical spreading is from a point source radiating sound equally in all directions. In this case, the difference in SPL (in dB) can be calculated using an equation derived from The Engineering Toolbox website as:
∆SPL = SPL2 – SPL1 = 20 log (d2 / d1)
thus, when the distance is doubled the difference in sound pressure level for point source is 6 dB.
In the case of cylindrical spreading, such as noise along a highway or a passing train, the difference in SPL (in dB) is given as:
∆SPL = SPL2 – SPL1 = 10 log (d2 / d1)
thus, when the distance is doubled the difference in sound pressure level for a line source is 3 dB.
Sound Barriers and Insertion Loss. The SPL-distance equations given in the section above are valid provided there is no sound barrier (such as a solid wall structure) in the direct sound path from the source to the receiver. If a sound barrier is present then the insertion loss (that is, noise attenuation) due to the sound barrier must be considered (Figure 2).
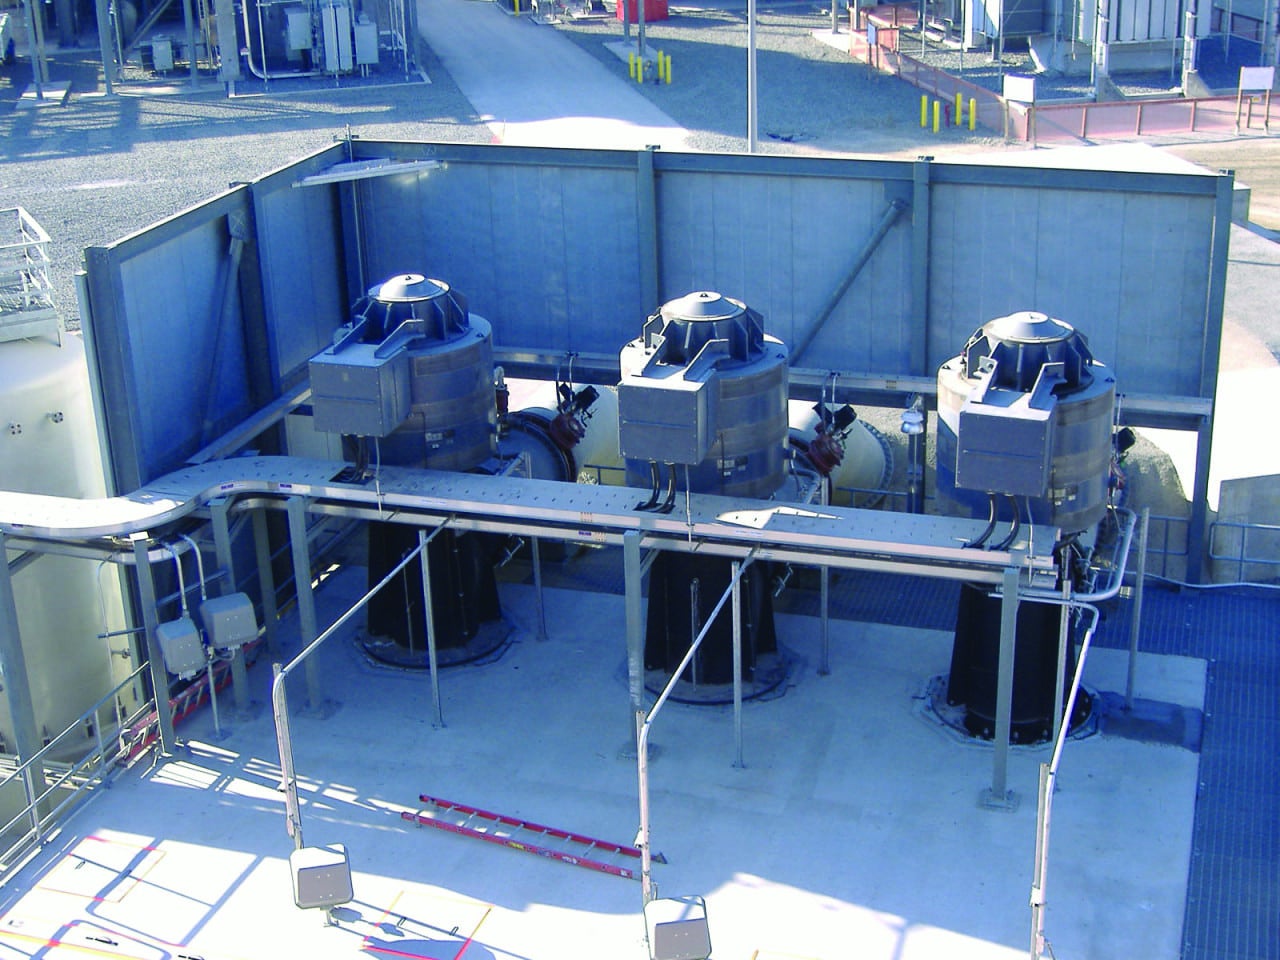 |
| 2. Sound barrier. Noise barriers were installed around the vertical pumps shown here to reduce noise levels in the surrounding area. Courtesy: Bechtel Corp. |
To calculate the insertion loss, first calculate the direct path length (d) between the source and receiver. Then, calculate the extended path length between the source and receiver due to the sound barrier. In the case of a solid wall, the extended path length would go from source to the top of the wall (distance A) and then down to the receiver (distance B). The path length difference (A + B – d) is then used to find the insertion loss from Table 3.
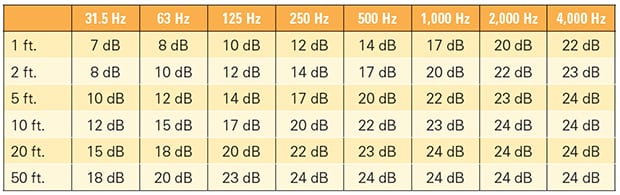 |
| Table 3. Insertion loss. This table shows the insertion loss (dB) for each frequency band (Hz) based on the extended path length (ft.) caused by a wall. The extended path length is the distance the sound would travel to the top of the wall and then down to the receiver, minus the straight-line distance from source to receiver. Source: 2015 ASHRAE Handbook: HVAC Applications, I-P Edition |
Noise Calculations for Building Service Equipment
As an example, consider the noise generated by an in-duct fan supplying atmospheric air through a single outlet diffuser in a room within a building. The SPL in the room reaching the observer’s ear is the logarithmic sum of the direct SPL and the reverberant SPL.
The details for calculating the SPL reaching the observer’s ear are as follows:
1. Use the fan manufacturers’ SPL noise spectrum across the various frequencies as the starting point.
2. Analyze the duct system between the fan and the room diffuser outlet, and evaluate the duct attenuation based on straight runs and duct bends.
3. At low frequencies, the sound power reaching the outlet diffuser is partly reflected back in the duct. This is the outlet reflection effect, which provides some degree of attenuation. The values for the outlet reflection effect are available in literature and are based on the area of the outlet diffuser.
4. Total duct attenuation is therefore the sum of #2 and #3 above.
5. Total SPL leaving the system can then be evaluated by subtracting #4 from #1.
6. The SPL values in #5 then need to be adjusted for the following three factors:
- ■ Percent of total fan airflow leaving the room outlet (5%, for example)
- ■ Distance from the outlet to observer (1 to 2 meters, for example)
- ■ Directivity, which is based on the location of the outlet with respect to corners and walls.
The effect of the first two adjustments is an SPL decrease, whereas the third factor tends to increase the value.
7. The adjusted value calculated in #6 is the direct SPL.
The next step is to calculate the reverberant SPL, which is done as follows:
1. Sum the impact of reverberant factors from the percentage of fan air volume serving the room under analysis; the room volume factor, which accounts for reflection/absorption of sound in the room; and the reverberation time factor.
2. The reverberant SPL can then be calculated as the sum of SPL leaving the system and the impact of reverberant factors. That is, adding #5 from the direct SPL analysis and #1 above.
3. Finally, the combined SPL can be calculated as the logarithmic sum of direct SPL and the reverberant SPL. That is, using #7 from the direct SPL analysis and #2 above.
The combined SPL established above can then be compared with the design basis noise criteria to determine if further attenuators are required. In some cases, sound levels in a room may be affected by duct breakout (sound energy escaping through the walls of a duct passing near an occupied space that does not serve that area). However, based on a paper published by Trox Technik titled “Sound and Sense,” noise due to duct breakout can be mitigated by limiting duct attenuation to 15 dB.
Vibrations and Ground-Borne Noise
Vibration levels (in decibels, VdB) are defined using the following equation, found in Fundamentals of Acoustics by J. Paul Guyer of Continuing Education and Development Inc.:
VdB = 10 log (v1 / vref)2
where v1 / vref is the ratio of the velocity amplitude with v1 as the root mean square of the velocity amplitude (in meters/second) and vref as the reference expressed in velocity units such as 5 x 10⁻⁸ meters per second. (Reference values may vary when using U.S. units.)
Rotating machinery, vehicles, and trains excite the ground and generate waves that propagate through the soil to the foundations of nearby buildings. The foundations propagate the waves to room structures. The rumble often heard is noise from the movement of building room walls, floors, and ceilings, and the threshold for human perception of ground-borne noise is around 65 VdB.
The unweighted SPL is approximately equal to the average vibrational velocity level of the room surfaces (assuming a room with average acoustical absorption). The A-weighting correction at 30 Hz is approximately –40 dB and at 60 Hz is –25 dB. Accordingly, if the vibration velocity level peaks at 30 Hz, the ground-borne noise level is 65 – 40 = 25 dBA, and if it peaks at 60 Hz, the ground-borne noise level is 65 – 25 = 40 dBA. ■
—S. Zaheer Akhtar, PE is principal engineer with Bechtel Corp. Thanks to Henrik Olsen, senior noise and vibration specialist with Bechtel Corp. for reviewing and providing valuable comments.