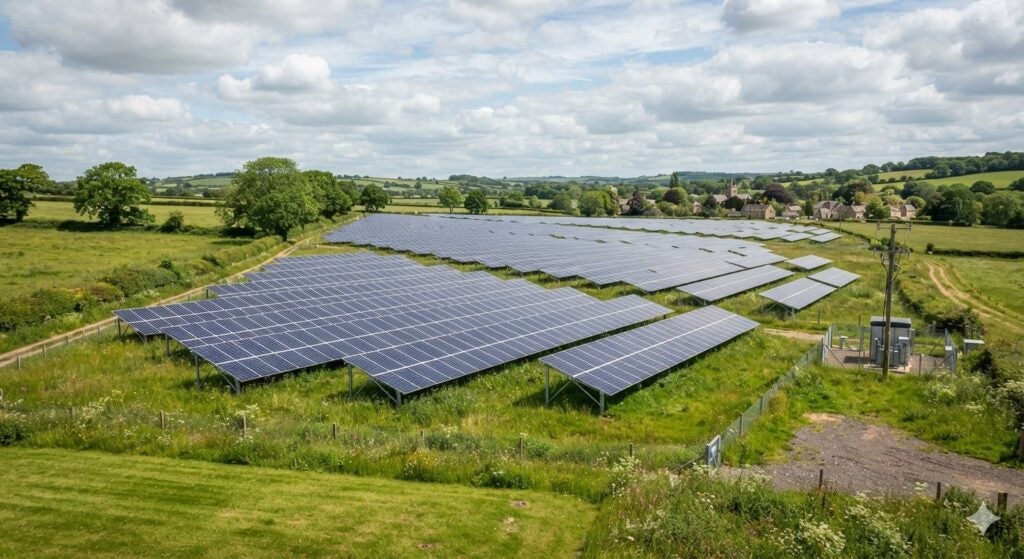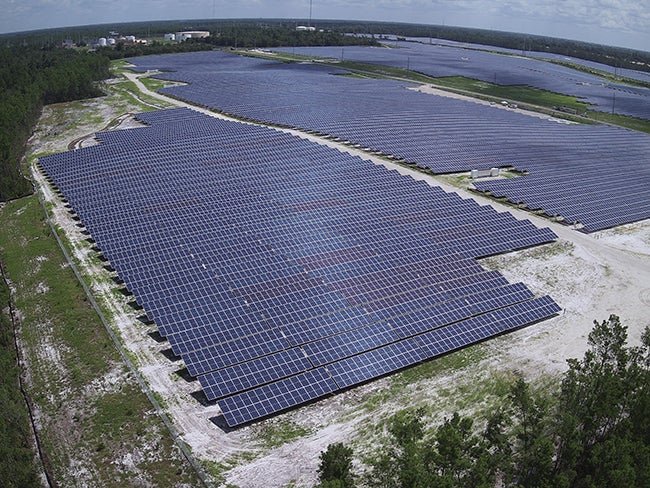
Utility-scale solar plants can lose energy without experiencing a complete equipment failure. Dust accumulation can reduce module output, inverter derating can constrain power conversion, tracker faults can leave arrays at suboptimal angles, and communication problems can prevent operators from recognizing underperformance promptly. Some losses are unavoidable, but others can be identified, quantified, and corrected through a disciplined operations and maintenance (O&M) program.
The challenge is distinguishing a genuine equipment or maintenance problem from normal changes in irradiance, module temperature, grid conditions, and plant operating requirements. A plant producing less electricity than expected is not necessarily underperforming because of a faulty component.
Operators need reliable monitoring data, a consistent performance baseline, and a method for connecting detected anomalies to recoverable energy. An effective O&M approach therefore follows a clear sequence: establish expected performance, identify the source of deviation, estimate its energy impact, prioritize the corrective action, and verify the result after the work is completed.
Establish a Reliable Performance Baseline
A maintenance team cannot determine whether a plant is losing energy until it has established how much energy the facility should have generated under the conditions observed.
Comparisons against historical output alone can be misleading. A cloudy afternoon may produce lower generation than the previous day even when every component is functioning correctly. Seasonal changes in solar angle, ambient conditions, module temperature, and irradiance also influence output.
Operators should use weather-adjusted expected generation alongside several complementary performance indicators:
- Performance ratio (PR): Compares actual energy yield with the yield expected from the available solar resource, using a consistent calculation method and accounting for relevant system conditions.
- Availability: Measures the proportion of time that defined equipment or the plant is capable of operating, according to the agreed availability methodology.
- Energy yield: Tracks generated energy over a defined period, normally normalized by installed capacity where appropriate.
- Performance index (PI): Compares actual production with a modeled or expected production profile, helping identify deviations after relevant environmental and operational effects are considered.
No single indicator describes every loss. A plant can report high equipment availability while generating less energy than expected because of soiling, partial string failures, or tracker misalignment. Conversely, a short inverter outage during a period of low irradiance may have little effect on daily energy but still reveal a recurring reliability problem.
The scale of the issue is visible in independent fleet research. The 2024 report Availability and Performance Loss Factors for U.S. PV Fleet Systems analyzed data representing approximately 8.5 GW of photovoltaic capacity and 24,000 inverter data channels. Across 1,128 systems assessed for availability, the reported median system availability was 99%, while the lower-decile availability figure was 95%, excluding the first six months of system operation. The results show why fleet averages should be treated as reference points rather than universal performance targets: individual plants still need to be evaluated against their equipment, operating conditions, contractual definitions, and maintenance history.
Operators should also document the measurement boundary. Grid curtailment, export restrictions, planned shutdowns, and unavailable external infrastructure should not automatically be classified as equipment-related energy losses. Separating them from plant-controlled losses helps maintenance teams focus on problems they can actually resolve.
Use Monitoring Data to Locate the Loss
Modern solar plants generate substantial volumes of operational data from inverters, revenue meters, weather stations, string monitors, tracker controllers, protection systems, and supervisory control and data acquisition (SCADA) platforms. The value of that information depends on how effectively it is combined and interpreted.
A plant-level output deviation is a useful starting point, but not a diagnosis. Teams should progressively narrow the investigation from total facility output to inverter blocks and, where instrumentation allows, individual strings or components.
A practical diagnostic sequence includes:
- Confirm the deviation. Check whether measured production is below weather-adjusted expectations and whether irradiance, temperature, timestamps, and meter readings are credible.
- Identify the affected boundary. Compare plant output with inverter-level production, DC-side measurements, and relevant equipment status signals.
- Check the time pattern. Determine whether the deviation is continuous, intermittent, temperature-dependent, limited to specific daylight periods, or associated with a recent event.
- Inspect related alarms. Review fault codes, trip histories, communication gaps, protection events, and control-system commands.
- Estimate the energy consequence. Quantify the difference between expected and actual output over the affected interval, using a defensible baseline.
This approach helps distinguish a physical failure from a data problem. An apparent loss may result from a failed sensor, a communications outage, a time-synchronization error, or incorrect status mapping rather than reduced electrical generation.
Data-quality checks deserve particular attention when analytics or automated alerts are used. Missing intervals should not automatically be interpreted as zero production, and implausible sensor readings should be flagged before they enter performance calculations. Where the monitoring system cannot resolve an anomaly, field inspection and appropriate electrical testing remain necessary.
The objective is not to generate more alarms. It is to identify the smallest credible set of causes that explains the loss and directs technicians toward the appropriate corrective action.
Treat Soiling as a Measured Loss
Dust, pollen, agricultural residue, bird droppings, salt deposits, and other surface contamination reduce the sunlight reaching photovoltaic cells. Their effect varies with local conditions, module tilt, rainfall, surface characteristics, and the time elapsed since the previous cleaning.
A fixed cleaning schedule may be appropriate where contamination patterns are predictable, but it can also cause unnecessary water use, labor expenditure, and equipment wear. Cleaning too late can leave a plant operating below its expected yield for an extended period; cleaning too frequently can consume resources without recovering enough energy to justify the expense.
Operators should estimate soiling losses using appropriate methods, such as paired clean and soiled reference devices, validated soiling sensors, periodic module inspections, or carefully designed comparisons between expected and actual production. Sensor placement, calibration, representative sampling, and maintenance of the reference devices all affect the reliability of the results.
The 2024 U.S. PV fleet study examined soiling using a method designed to help separate recoverable soiling effects from longer-term degradation. It reported irradiance-weighted soiling losses above 1% for the systems included in its reported soiling assessment. That result should not be applied as a blanket estimate to every solar plant; it illustrates why soiling warrants measurement rather than assumptions.
Cleaning decisions should be based on expected energy recovery and the cost of achieving it. A simplified assessment compares:
Expected value of cleaning = recoverable energy × expected realized value per unit of energy − cleaning cost.
The energy estimate should reflect the irradiance likely to occur before the next planned cleaning, not simply the plant’s nameplate capacity. The calculation should also consider water availability, labor, cleaning equipment, site access, module warranties, and any risks associated with cleaning methods.
After cleaning, the team should compare measured performance with a weather-adjusted baseline. A weak or short-lived improvement may indicate that contamination was not the main source of the original deviation, or that another issue remains unresolved.
Reduce Inverter and Balance-of-System Losses
Inverter-related losses can be more complex than a complete unit shutdown. Thermal derating, repeated trips, control faults, DC input imbalance, abnormal voltage conditions, and component degradation may reduce output intermittently. Because inverters consolidate the output of many module strings, a single fault can affect a substantial portion of plant capacity.
Operators should examine inverter alarms and event logs alongside power output, DC voltage and current, operating temperature, cooling-system status, and equipment-specific limits. Comparing inverters exposed to similar irradiance and temperature conditions can help identify outliers that merit investigation.
A useful review should answer three questions:
- Is the inverter unavailable, or is it operating but producing less than expected?
- Does the event recur under a particular operating condition?
- Is the root cause within the inverter, on the DC side, in its control settings, or elsewhere in the electrical system?
Balance-of-system components also deserve consistent attention. Faulty connectors, degraded cables, protective-device trips, transformer issues, and string-level underperformance may remain hidden when monitoring is limited to plant-level production.
Thermal imaging, electrical measurements, insulation testing, and connector inspections can help locate developing defects when performed by qualified personnel under appropriate safety procedures. Inspection results should be tied to component identifiers and retained as part of the asset history rather than stored only as isolated work orders.
Tracking systems require a similar combination of data and field inspection. Misalignment, actuator problems, communication loss, or incorrect control settings can prevent modules from following their intended orientation. Operators should compare commanded and measured tracker positions and assess whether deviations correspond with periods of reduced generation. A fault affecting several rows may deserve faster intervention than an isolated issue, depending on the energy exposure and safety implications.
Move From Calendar-Based Maintenance to Condition-Based Work
Preventive maintenance remains essential. Scheduled inspections, electrical checks, lubrication where applicable, filter replacement, vegetation management, and manufacturer-recommended servicing help reduce failure risk. However, a calendar alone cannot identify every emerging defect or account for how operating conditions change over time.
Condition-based maintenance uses observed equipment condition to determine when inspection or intervention is required. Predictive maintenance goes further by using trends, failure histories, and analytical methods to estimate emerging problems before they cause an outage.
A balanced program combines scheduled work with condition-triggered interventions:
- Inverters: Review repeated trips, thermal excursions, cooling-system performance, and changing operating patterns.
- Trackers: Identify position mismatches, actuator anomalies, stalled rows, and repeated communication faults.
- Modules and strings: Investigate persistent output differences, abnormal electrical readings, and physical damage.
- Electrical infrastructure: Track protection events, transformer alarms, cable defects, and recurring connection problems.
- Site conditions: Monitor vegetation, drainage, erosion, access roads, and contamination patterns that affect safe and reliable operation.
This approach is consistent with the operational focus discussed in POWER’s article, “The POWER Interview: Predictive Maintenance Key for Solid Solar Performance”, which addresses the importance of anticipating equipment issues and planning repairs, staffing, and spare-parts requirements.
Condition-based work still requires engineering judgment. A warning signal does not automatically justify replacing a component. Teams should check alarm reliability, verify the underlying fault, consider warranty conditions, and assess the consequences of intervention before committing resources.
Prioritize Maintenance by Recoverable Energy
Maintenance teams rarely have enough labor, spare parts, access windows, and budget to address every issue immediately. Prioritization should therefore consider both plant risk and the expected benefit of a repair.
Safety-critical defects and risks of equipment damage must take precedence. Among non-emergency interventions, operators can compare the expected energy recovery, duration of the fault, likelihood of recurrence, repair cost, resource availability, and contractual implications.
One practical method is to estimate the energy loss associated with each issue:
Estimated energy loss = expected output during the affected interval − actual output during that interval
The estimate requires an appropriate weather-adjusted baseline and a clear treatment of curtailment, data gaps, and other external constraints. For recurring faults, teams should also estimate how much future production could be lost if the issue remains unresolved.
Consider an illustrative case in which an inverter block is expected to deliver 1.6 MW under the recorded conditions but produces 1.44 MW for four hours. The estimated shortfall is 0.16 MW × four hours, or 0.64 MWh. This is a simplified example rather than a measured plant result; the actual calculation would need to account for changing irradiance, temperature, operating limits, and the confidence of the baseline.
The example illustrates why teams should look beyond alarm severity. A fault lasting through peak generation may justify faster action than a similar-duration fault during low-output hours. At the same time, an intermittent defect with a high probability of escalating into equipment damage may warrant intervention even when its immediate energy loss appears modest.
Work orders should record the estimated impact, investigation findings, repair requirements, and rationale for prioritization. Over time, this evidence can help operators improve maintenance planning and spare-parts strategies.
Account for Hybrid Solar-Plus-Storage Operations
The performance boundary becomes more complicated when a solar plant operates alongside battery storage. PV generation, battery charging and discharging, conversion losses, state-of-charge limits, dispatch instructions, and grid-export constraints can all affect the energy delivered to the grid.
The U.S. Advanced Energy Storage Systems report from Vyansa Intelligence forecasts growth from USD 2.89 billion in 2025 to USD 6.29 billion by 2032, equivalent to a projected compound annual growth rate of 11.29% for 2026–2032. Although this is a storage-sector forecast rather than a solar performance metric, it provides relevant context for operators managing increasingly integrated power assets.
For hybrid facilities, O&M teams should keep PV generation and battery performance measures distinct. A reduction in grid exports does not necessarily indicate a loss of solar generation: energy may have been stored, curtailed, or limited by dispatch or interconnection requirements. Conversely, an apparently healthy PV array may be paired with a battery system that has reduced availability or constrained charging capability.
Clear metering boundaries, synchronized data, documented dispatch instructions, and separate equipment performance indicators are essential. Without them, teams risk attributing losses to the wrong asset and taking corrective actions that do not address the underlying problem.
Verify Every Corrective Action
Completing a repair or cleaning activity does not, on its own, prove that performance has improved. Verification should be built into the work order and carried out once operating and environmental conditions allow a meaningful comparison.
Before intervention, the team should record the suspected cause, affected equipment, alarm history, baseline method, estimated energy impact, and relevant operating conditions. After the work, it should confirm that the defect has been resolved and compare the equipment’s performance with the same baseline or a suitably adjusted equivalent. A sound verification process should establish whether:
- The original alarm or abnormal condition has cleared.
- Output has returned toward the expected level under comparable conditions.
- The fault has not recurred during an appropriate observation period.
- The action created any secondary issues or introduced new alarms.
- The actual outcome is consistent with the estimated energy recovery.
The resulting record should capture labor, parts, downtime, recovered energy where measurable, and any remaining uncertainty. Failed repairs and partial recoveries also need to be documented because they can reveal an incorrect diagnosis, an incomplete intervention, or a broader system problem.
Turn Maintenance Records Into Operating Improvements
The most valuable O&M programs do more than restore individual components. They use the results of each intervention to improve future decisions.
Operators should review a concise set of indicators at regular intervals: weather-adjusted energy deviations, equipment availability, repeat-fault frequency, repair duration, soiling losses, and the energy recovered from completed corrective actions. Financial measures, such as maintenance cost per MWh recovered, can complement engineering indicators where the data supports a credible calculation.
Recurring defects should lead to a root-cause review rather than repeated reactive repairs. If the same inverter fault appears across several sites, for example, the response may involve revised inspection intervals, a component replacement strategy, firmware or control review, or coordination with the equipment supplier. If cleaning repeatedly produces little measurable benefit, the soiling assessment or cleaning method may need to be reconsidered.
The U.S. Dept. of Energy’s solar O&M resources provide further guidance on maintaining photovoltaic systems and mitigating problems that can affect lifecycle performance. Reducing performance losses ultimately depends on connecting monitoring, field inspection, engineering analysis, and maintenance execution. Operators that measure deviations consistently, distinguish recoverable losses from external constraints, and verify the outcome of each intervention can allocate resources more effectively and build a clearer picture of plant reliability. The aim is not merely to keep equipment running; it is to recover the energy that can reasonably be recovered, document what remains outside operational control, and use that evidence to improve the next maintenance decision.
—Shammi Thakur is the Research Director at Vyansa Intelligence. Thakur has more than 15 years of experience in research, strategic intelligence, industry analysis, forecasting, and competitive insights. His work examines technology and operational developments across the energy industry.