by Josh Bryant — CAMS
As winter approaches in Texas, ERCOT has released its winter seasonal assessment of resource adequacy (SARA) and required generators to attest to their winter preparations. While the likelihood of an extreme event like the 2021 Winter Storm Uri is rare, ERCOT will be reviewing each winter with the consideration of that possibility. We looked at the additional renewable and storage capacity brought online since early 2021, estimated the additional generation it would have provided, and analyzed its impact on the Operational Reserve Demand Curve (ORDC).
Energy from the Additional Renewable Capacity
It is common to hear of additional power generation capacity measured in megawatts (MW). Megawatt is the maximum amount of power a generator can produce at a given moment, a valuable measurement. Less commonly, you hear the amount of energy a facility produces, which is measured in megawatt hours (MWh). Megawatt-hour is the power generated multiplied by the duration of the generation period. All facilities (thermal and renewable) have periods where they produce less than their maximum capacity due to factors such as maintenance, temperature, wind, and sunshine. Instead of quoting the number of MWs of additional wind and solar plants that have been built, we took the actual generation from February 2021, adjusted it for the new capacity, then compared the impact on total energy generation. Similarly, we compared the amount of potential energy storage generation (removing availability for charging times). Below are the results of comparing 2021 Actual with 2023 Hypothetical:
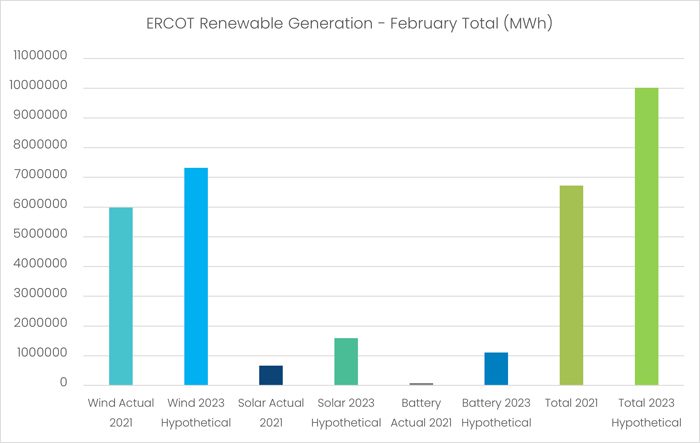
Source: CAMS eTRAC
According to our observation, wind would provide 31% more energy from its existing large base of generation. Solar energy would increase its generation contribution by 140% as utility-scale solar installations have rapidly increased over the last two years. Energy storage was nascent in 2021 but has expanded its potential to contribute an incredible 1301%.
While these energy gains in the renewables sector are very strong, renewables still contribute only ~30% of the total energy to the ERCOT grid. Measured against the entire energy use of ERCOT, they could have provided 13% more total energy in the month of February (23% actual in 2021 versus 36% Hypothetical).
Value of the Additional Renewable Capacity
Another way to measure the additional renewable capacity is to estimate the value it would provide to the market through lower power prices. Energy markets (including ERCOT) run real-time models that generate locational marginal prices (LMPs) based on the locational supply and demand for energy. In addition to having locational prices, ERCOT includes a market-wide price adder (ORDC) when required demand begins to approach the amount of available generation capacity, encouraging more generation to be available. It is difficult to rerun the pricing models with any accuracy; however, we can directly calculate the value of reducing the ORDC price.
For this calculation, we focused on February 11th – 19th, the highest period of ORDC. First, we recalculated the ORDC pricing from February 2021 with two changes made to the pricing since that time. The first change was the reduction of the max market price from $9000 / MWh to $5000 / MWh. The second change was a more aggressive ORDC curve, encouraging generation to be available more quickly. After adjusting the 2021 data to the new 2023 ORDC curve, we added the generation from the new renewables capacity and recalculated the new lower ORDC price with that energy contribution. Below are the results:


Source: CAMS eTRAC
Comparing 2021 ORDC to 2023 ORDC, the difference is extremely minimal, with 2023 ORDC less than 1% more in total ORDC over the period reviewed. The reduction from a $9000 price cap to a $5000 price cap was fully offset by the more aggressive ORDC curve. Going one step further and adding in the estimated additional renewable generation massively reduced the total ORDC by 64% at a total value of $23.65 per MWh through this significant scarcity event.
While winter events (and prices during these events) are complicated to predict, the significant growth in renewable energy and energy storage can contribute valuable energy during times of scarcity pricing.
About CAMS
CAMS is a privately held company providing Operations and Maintenance (O&M), Asset Management, Environmental, Social, and Governance (ESG), and Optimization services for energy and infrastructure assets. We add value through superior management and operation of our clients’ assets throughout the U.S. and internationally. At CAMS, we keep a close eye on plant operations and maintain a comprehensive view of the commercial and operational risks facing our power plants. To do this, we use our proprietary eTRAC software to watch our plants, market, and weather-relevant signals in a unified interface.
For more information, visit ![]()
About Josh Bryant
Josh Bryant leads CAMS Wind Turbine Engineering and Analytics. He led the eTRAC product’s development, combining engineering and data science with CAMS’ experience managing power assets in the ERCOT market. He holds a Bachelor of Science degree in mechanical engineering from the University of Central Florida.