Infographics
-
 News
NewsChart Shows Rise in Wind, Solar; Overall Drop in Energy Use
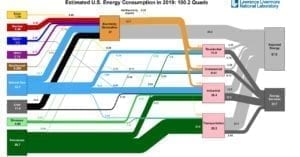
Lawrence Livermore National Laboratory’s (LLNL’s) latest annual energy flow chart suggests that in 2019, for the second year in a row, wind and solar made up the largest increases in U.S. energy supply, but American consumption of energy fell after a record year in 2018. The national lab’s annual U.S. energy flow chart, or Sankey […]
-
 Nuclear
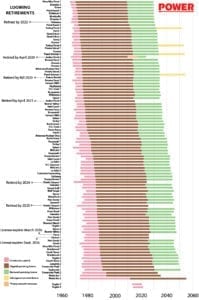
THE BIG PICTURE (Infographic): U.S. Nuclear Lifetimes
The U.S. has 96 licensed-to-operate nuclear power reactors and two reactors under construction. But the average age of the nation’s 96 licensed nuclear units is about 39 years old. That has been of some concern to the nuclear industry, which has provided roughly a fifth of the nation’s power since the 1990s. About 88 of […]
-
 News
NewsTHE BIG PICTURE [Infographic]: Solar’s Explosive Growth
According to the International Energy Agency’s (IEA’s) World Energy Outlook 2019, solar photovoltaic (PV) is set to become the largest source of installed electrical capacity in about 2035, if countries pursue policies as planned. By 2040, solar could make up 24% of global installed capacity—up from 7% in 2018—but its share of generation could hover […]
-
 Hydrogen
A Review of Global Power-to-Gas Projects To Date [INTERACTIVE]
According to experts from Technical University of Applied Sciences (OTH) in Regensburg, Germany, who recently reviewed the world’s existing power-to-gas (P2G) hydrogen and methane projects, about 143 P2G projects have operated since 1988 in 22 countries. Only 56 hydrogen and 38 methanation projects were active in 2019. While the existing fleet mostly comprises pilot or […]
-
 Renewables
THE BIG PICTURE: The Need for Power Flexibility
In its November 2019–issued World Energy Outlook, the International Energy Agency (IEA) suggests that if countries pursue currently stated policies, the combined generation share of wind and solar photovoltaic could surge from 7% today to 24% in 2040. This very steep ramp-up of variable renewables will undoubtedly require an emphatic focus on flexibility—the ability of […]
-
 Infographics
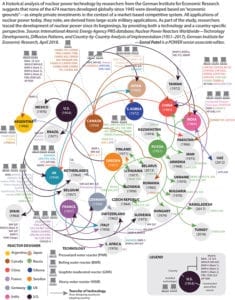
THE BIG PICTURE: The Diffusion of Nuclear Technology
A historical analysis of nuclear power technology by researchers from the German Institute for Economic Research suggests that none of the 674 reactors developed globally since 1945 were developed based on “economic grounds”—as private investments in the context of a market-based competitive system. Until the 1950s, only four major countries dominated nuclear technology by establishing independent […]
-
 Hydrogen
THE BIG PICTURE: Hydrogen Power
Hydrogen is emerging as a formidable player in the energy transition, owing to its potential to decarbonize a range of sectors and its versatility. According to a June 2019–released report prepared for the G20 by the International Energy Agency (IEA) and the government of Japan, 76% of dedicated hydrogen produced today (around 70 metric tons) […]
-
 News
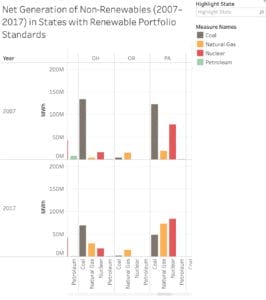
NewsHow Net Generation Has Changed in States with Renewable Portfolio Standards
As of August 2019, 29 U.S. states and the District of Columbia had renewable portfolio standards (RPSs), and eight others had non-binding renewable portfolio goals. Three states also had clean energy standards, which set targets for low-carbon non-renewables, like nuclear, and two had clean energy goals. Our monthly infographic in September 2019 shows how shares for each […]
-
 News
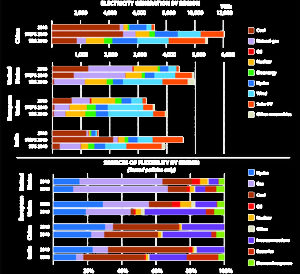
NewsTHE BIG PICTURE: Renewable Portfolio Standards
As of August 2019, 29 U.S. states and the District of Columbia had renewable portfolio standards (RPSs), and eight others had non-binding renewable portfolio goals. Three states also had clean energy standards, which set targets for low-carbon non-renewables, like nuclear, and two had clean energy goals. Shown in the bars below are the shares of generation by source […]
-
 Technology
Five Inspections Made Easier with Drone Technology
Today, drones equipped with sensors and cameras are proving their worth in gathering real-time footage that can be stored for later analysis. Uncrewed aerial systems can detect failing structures and equipment
-
 History
A Brief History of GE Gas Turbines
July marks two important milestones that set gas-fired generation on its course to becoming a dominant form of power generation: commercial operation of the world’s first industrial gas turbine in Neuchâtel, Switzerland, in 1939, and commercial operation of the first gas turbine in the U.S. used to generate electric power—a 3.5-MW General Electric (GE) unit […]
-
 History
THE BIG PICTURE: Siemens’ Corporate History
Siemens AG, the global technology conglomerate that today has headquarters in both Berlin and Munich, in May 2019 announced it will spin off its energy units to focus on its digital “core.” The news has stunned many in the power sector, where Siemens has clenched a formidable presence since 1866. But restructuring at Siemens is […]
-
 IIOT Power
THE BIG PICTURE: 30 Innovations Revolutionizing the Power Industry
Between 2005 and 2016, the global installed capacity of solar PV increased more than seven-fold, and the capacity of onshore wind increased nearly three-fold, and owing to plunging costs, variable renewable energy (VRE) capacity is set to expand dramatically, according to the International Renewable Energy Agency (IRENA). To accommodate soaring shares of VRE generation, innovations […]
-
 News
NewsTHE BIG PICTURE: Japan’s Nuclear Comeback
After the Great Tohoku Earthquake and tsunami, and ensuing crisis at the Fukushima Daiichi nuclear plant in March 2011, Japan issued stringent safety regulations and reviews that affected its entire 50-reactor fleet. It meant that as each Japanese nuclear reactor entered its scheduled maintenance and refueling outage, it could not returned to operation until restart […]
-
 Infographics
THE BIG PICTURE: World’s Biggest Power Companies
In 2017, the 10 largest power companies, ranked by their installed generation capacity, owned 18% of total global installed capacity, while the next-largest 15 owned around 10%—meaning that the top 25 companies own nearly 30% of global installed power generation capacity, according to the International Energy Agency (IEA). Chinese companies account for more than one-eighth of global installed […]
-
 News
NewsHow Efficiently Have U.S. Nuclear Reactors Operated Over the Past Five Years? [INFOGRAPHICS]
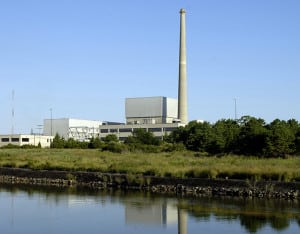
According to the Nuclear Regulatory Commission (NRC), the nation’s 99 operating nuclear reactors operated at an average capacity factor of 88% in 2017—the same as in 2016—despite market forces that have rendered several units uneconomical. Figures for 2018 are expected in 2019 and may look different. Oyster Creek Nuclear Station, for example, was permanently closed […]
-
 News
NewsTHE BIG PICTURE: Power Around the World
The International Energy Agency forecasts that based on current and proposed policies, global power generation will grow about 15,000 TWh (about 60%) from 2017 to 2040. About 70% of additions will be supplied by natural gas, wind, and solar photovoltaics in nearly equal shares. But despite a drop from its current share from 38% to […]
-
 News
NewsTHE BIG PICTURE: Wind Turbine Trends
Average wind turbine capacity, rotor diameter, and hub height increased in 2017, continuing a long-term trend. One reason that wind producers choose bigger turbines is to optimize wind power project cost and performance, according to the U.S. Department of Energy’s Office of Energy Efficiency and Renewable Energy. Source: U.S. DOE, 2017 Wind Technologies Market Report, […]
-
 Infographics
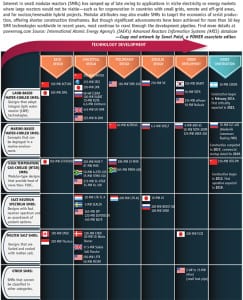
THE BIG PICTURE: Small Modular Reactors
Interest in small modular reactors (SMRs) has ramped up of late owing to applications in niche electricity or energy markets where large reactors would not be viable—such as for cogeneration in countries with small grids, remote and off-grid areas, and for nuclear/renewable hybrid projects. Modular attributes may also enable SMRs to target the economics of […]
-
 Infographics
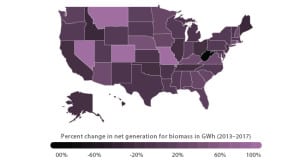
Interactive Chart: Change in U.S. Biomass Generation (2013 to 2017)
While the larger conversation about plant economics and mass retirements in the U.S. has been focused on coal and nuclear power plants, the nation’s much smaller biomass power industry is grappling with similar issues in markets where cheap natural gas, wind, and solar generation resources are proliferating. See more at: “U.S. Biomass Power, Dampened by […]
-
 Infographics
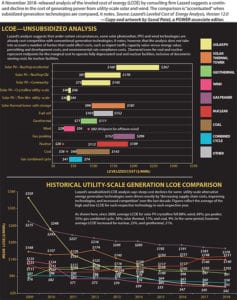
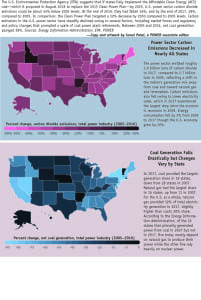
THE BIG PICTURE: A Power Sector Carbon Decline
The U.S. Environmental Protection Agency (EPA) suggests that if states fully implement the Affordable Clean Energy (ACE) rule—which it proposed in August 2018 to replace the 2015 Clean Power Plan—by 2025, U.S. power sector carbon dioxide emissions could be about 34% below 2005 levels. At the end of 2016, they had fallen 24%, and by the end […]
-
 Legal & Regulatory
THE BIG PICTURE: Trump’s Regulatory Targets
President Trump campaigned on a promise to reduce regulation and control regulatory costs. One of his first actions after taking office was to issue an executive order calling for the elimination of two existing regulations for every one new regulation issued. Toward that end, the Trump administration has acted or sought to reverse more than […]
-
 History
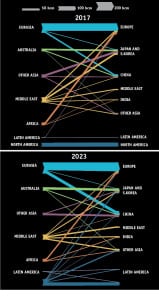
THE BIG PICTURE: A Gas Trade Transformation (Infographic)
According to the International Energy Agency, global natural gas trade has grown by more than 40% over the past 15 years. Over the next five years, current trade flows are expected to significantly diversify, boosted by development of liquefied natural gas (LNG) infrastructure. LNG trade, which grew by 11% in 2017 to 391 billion cubic […]
-
Infographics
THE BIG PICTURE: The Electric Vehicle Push
Because the widespread adoption of electric vehicles (EVs) could ramp up demand for electricity and slash transportation-related emissions of carbon dioxide and other pollutants, a growing group of stakeholders, including power companies and trade groups, strongly advocate for an accelerated EV rollout. By mid-2018, several countries with potentially large EV markets had set EV deployment targets, as well […]
-
Infographics
THE BIG PICTURE: A Cold Comparison
The “bomb cyclone,” a winter storm that descended on much of the eastern U.S. from December 27, 2017, to January 8, 2018, renewed the raging debate about resiliency and prompted flashbacks of the “polar vortex,” a similar deep freeze that transpired in January 2014 and was compounded by the loss of 82 GW nationwide for various reasons. […]
-
 Infographics
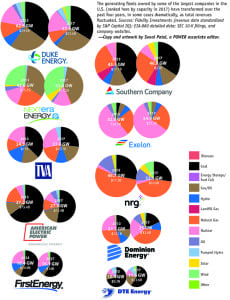
THE BIG PICTURE [INFOGRAPHIC]: Changing Fleets
The generating fleets owned by some of the largest companies in the U.S. (ranked here by capacity in 2017) have transformed over the past four years, in some cases dramatically, as total revenues fluctuated. Sources: Fidelity Investments (revenue data standardized by S&P Capital IQ); EIA-860 detailed data; SEC 10-K filings, and company websites. —Copy and artwork by Sonal Patel, a […]
-
 Infographics
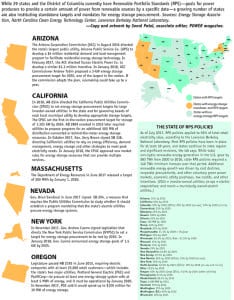
The Big Picture: Energy Storage Mandates
While 29 states and the District of Columbia currently have Renewable Portfolio Standards (RPS)—goals for power producers to provide a certain amount of power from renewable sources by a specific date—a growing number of states are also instituting standalone targets and mandates for energy storage procurement. Sources: Energy Storage Association, North Carolina Clean Energy Technology Center, Lawrence Berkeley […]
-
 History
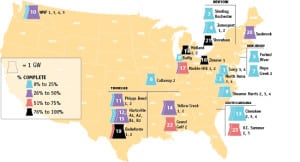
THE BIG PICTURE: Abandoned Nuclear
This month’s THE BIG PICTURE infographic is accompanied by an interactive map. For more, visit: https://www.powermag.com/interactive-map-abandoned-nuclear-power-projects/
-
History
THE BIG PICTURE: Abandoned Nuclear Power Projects (Interactive Map)
Increasing uncertainties concerning low forecasted load; construction financing constraints and reversals; state certification hurdles; and challenges to nuclear profitability posed by the growing share of coal plants beset the nuclear industry in the early 1970s. The nuclear suffered a renewed economic meltdown and fierce public pushback in the aftermath of the Three Mile Island accident […]