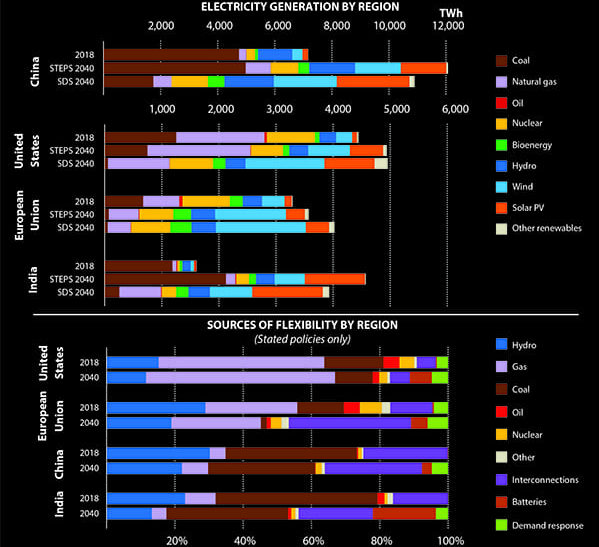
Solar photovoltaic (PV) power generation demonstrated the largest absolute growth of all renewable technologies in 2022, surpassing wind for the first time in history, according to the International Energy Agency (IEA). The IEA has said continuous growth in the economic attractiveness of PV, massive development in the supply chain, and increasing policy support, especially in China, the U.S., the European Union, and India, are expected to further accelerate capacity growth in the coming years.
In the IEA’s projections, cumulative solar PV capacity almost triples from today’s level through 2027, growing by about 1,500 GW during the timeframe. Notably, solar PV is expected exceed natural gas by 2026 and coal by 2027. Despite current higher investment costs due to elevated commodity prices, the IEA reports that utility-scale solar PV is the least-costly option for new electricity generation in a significant majority of countries worldwide.
As PV installations continue to see significant growth, protecting against unforeseen module degradation is crucial to minimize potential financial risks. Consequently, routine inspections to assess module reliability are essential. A study conducted in 2018 revealed that PV module degradation in India averaged 1.78% per year. These findings were derived using diagnostic tools like electroluminescence (EL) and current-voltage (IV) analyses, which play a pivotal role in evaluating both modules and PV power plants, facilitating the detection of faults.
This article aims to classify and explain the EL and IV characteristics commonly used in industries. Section I outlines definitions and methodologies for EL and IV measurements. Section II highlights key takeaways that are obtained from EL and IV analyses. Finally, Section III draws conclusions.
Definition and Methodology
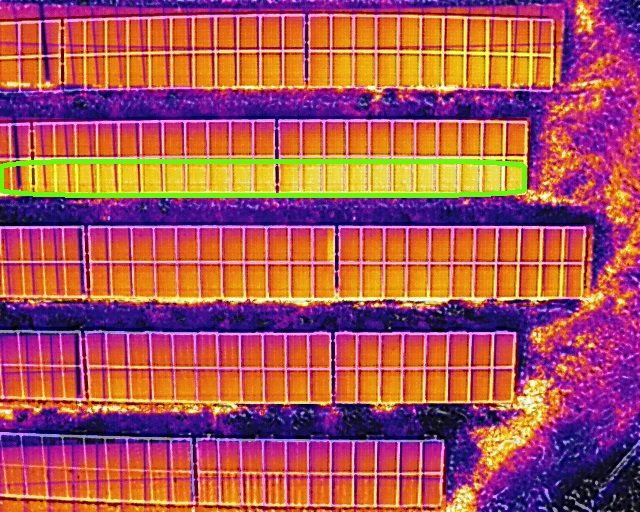
Cell Crack Detection Through Electroluminescence Image Analysis. Electroluminescence imaging offers valuable insights into the detection of micro cracks and defects inherent within the cell material, facilitating the identification of prevailing or emerging faults and issues within the PV module. This process involves the application of direct current (DC) to the PV module while using an infrared-sensitive camera to measure the photoemission. An electric DC power supply provides sufficient voltage to achieve short-circuit current (Isc). Three specific images are captured to conduct EL image analysis:
- At Isc
- At 0.1 × Isc
- At 0 × Isc to serve as background reference images
Before imaging, it is essential to ensure that the modules are thoroughly cleaned and contamination-free. The module’s temperature should be maintained from 20C to 30C. To monitor temperature accurately, a temperature sensor is placed on the rear side of the module—the side not undergoing imaging. This sensor is positioned such that it does not interfere with the imaging process. The final temperature reading, taken within 15 seconds after completing the image capture, is recorded for module temperature reporting.

In This Issue
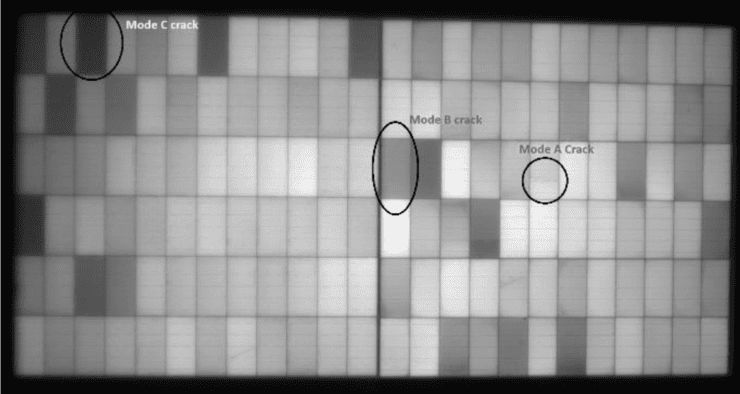
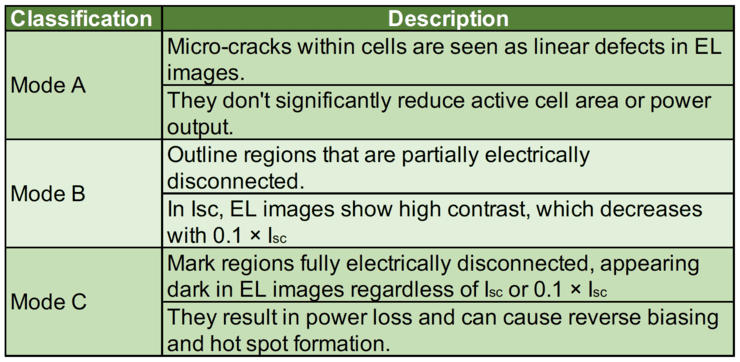
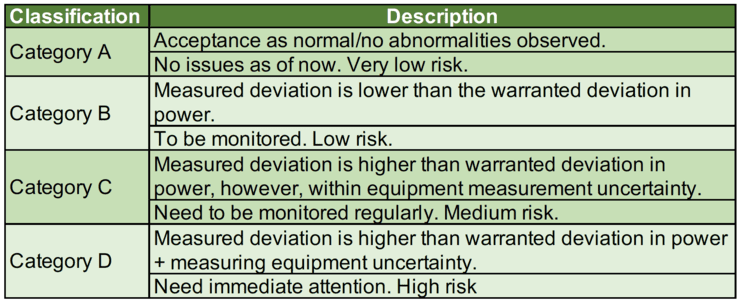
Full issueThe angle of view in relation to the module’s surface is maintained to be perpendicular to the module being imaged. The maximum angle of view deviating from the module’s normal must always be less than 50 degrees. During imaging, each image’s voltage, current, and module temperature is documented. Figure 1 and Table 1 depict the three types of cell cracks in accordance with the International Electrotechnical Commission (IEC) Technical Specification (TS) 60904-13 standard, which aligns with industry best practices as well. During the qualitative EL image analysis, other types of artefacts are also identified, such as spider cracks, bypass diode failures, soldering issues, and more. Based on the cell crack classification criteria (Table 1), PV modules are allocated to various risk categories, as illustrated in Table 2.

IV Analysis-Based Performance Classification. Plotting current against voltage serves as a vital indicator of PV system performance, revealing parameters like short-circuit current (Isc), open-circuit voltage (Voc), maximum power point parameters (Impp, Vmpp), and maximum power (Pmax). Indoor measurements are carried out using an MBJ sun simulator, meeting the A+A+A+ classification according to the IEC 60904-9 Ed. 3 standard, and equipped with an integrated EL camera (manufactured by Basler). When conducting field tests, a Solmetric PV analyzer kit is employed. To perform IV measurements, a voltage sweep is executed, starting from 0 to Voc for both poly and monocrystalline modules. However, for thin-film modules, a double sweep is performed. PIV (power [P]-current [I]-voltage-[V]) test-analysis criteria is shown in Table 3.
Key Takeaways
EL analysis results are presented in the format shown in Figure 2, indicating the count and percentage dark areas of cells with mode A, B, and C cracks, as well as the count of cells with various artefacts.
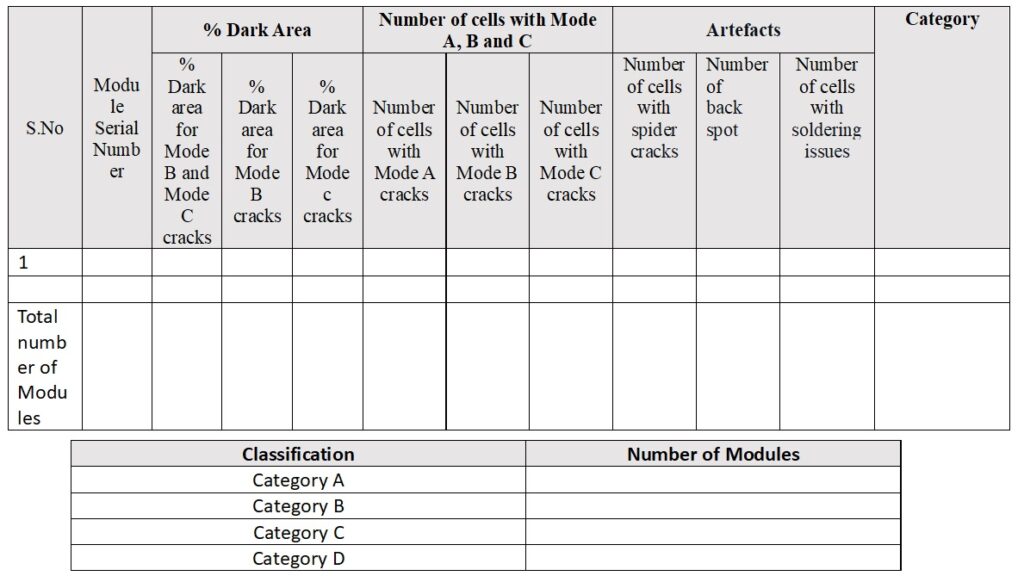
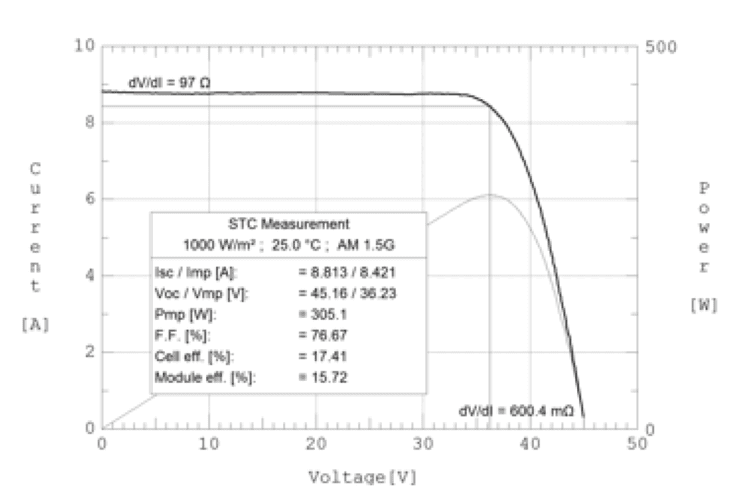
Figure 3 displays an example IV curve, from which the data presented in Tables 4 and 5 was derived. Table 4 outlines the computations necessary to categorize a group of modules into four distinct categories, as depicted in Table 5.
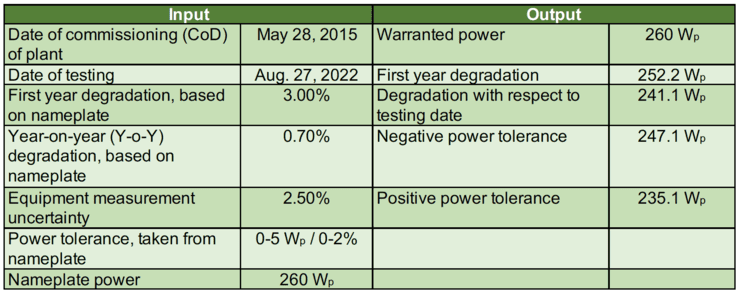
Explanation for the Sample Calculation
Warranted power = nameplate power – (1 – positive power tolerance %)
After first year degradation, power = 260 × (1 – 0.03) = 252.2 Wp
Power on testing date = power after first year degradation – power after first year degradation × [Y-o-Y degradation × (age of PV modules – 1)] = 252.2 Wp – 252.2 Wp × [0.007 × (7.3 – 1)] = 241.2 Wp
Power after considering positive tolerance of measuring equipment = power on testing date × (1 + positive tolerance of measuring equipment) = 241.2 × (1 + 0.025) = 247.2 Wp
Power after considering negative tolerance of measuring equipment = power on testing date × (1 + negative tolerance of measuring equipment) = 241.2 × (1 – 0.025) = 235.1 Wp
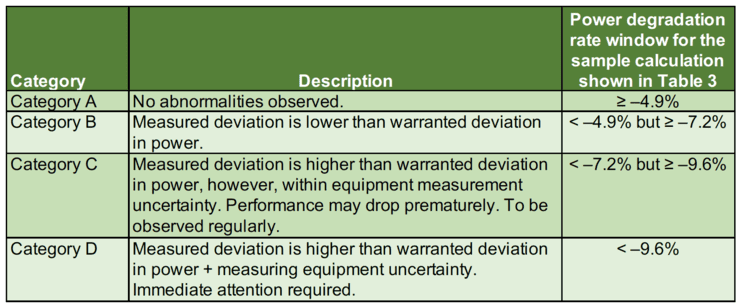
Category Calculation
Category A is computed as ≥ (power after considering positive tolerance of measuring equipment – nameplate power) / nameplate power ≥ (247.2 – 260) / 260 ≥ (–4.93%)
Category B is computed as ≥ (power on testing date – nameplate power) / nameplate power ≥ (241.2 – 260) / 260 ≥ (–7.25%)
Category C is computed as ≥ (power after considering negative tolerance of measuring equipment – nameplate power) / nameplate power ≥ (235.1 – 260) / 260 ≥ (–9.57%)
Category D is computed as < –9.57%
Conclusion
This article outlines the methodology and fault detection methods employed to categorize and describe a PV system’s condition via IV (current-voltage) and EL (electroluminescence) images. Conducting regular IV and EL analyses ensures early detection of faults, aligning with standards prescribed by the IEC and the International Organization for Standardization (ISO). This proactive approach not only helps in identifying potential issues sooner but also ensures compliance with the specified international standards, thereby maintaining the integrity and reliability of the system. Early fault diagnosis, as outlined in this article, is crucial for maintaining the optimal performance and longevity of PV systems.
—Sonali Bhaduri, Sumit Kumar, and Sourav Kumar are technical experts with Mahindra Teqo Pvt. Ltd., a technology-driven asset care company that offers optimization solutions for renewable energy customers in India and globally.