From pandemic shut-ins to production booms, arctic blasts to record heatwaves, the U.S. gas market in the 2020s has been volatile. But while many analyses have pointed the finger at increases in liquefied natural gas (LNG) exports and larger global market volatility tied to the Russian invasion of Ukraine, they have ignored the real culprit and wildcard factor that is happening right here at home.
No two sectors embody the natural gas price volatility more than the demand growth seen in LNG feedgas demand for exports and for domestic natural gas-fired electric generation—or power burn—which now collectively account for nearly half of all gas demand in the lower 48 U.S. states. But of those two, it is the less predictable and more decentralized increased demand for domestic power burn that will continue to be a more significant lever for future natural gas price volatility.
LNG State of Play
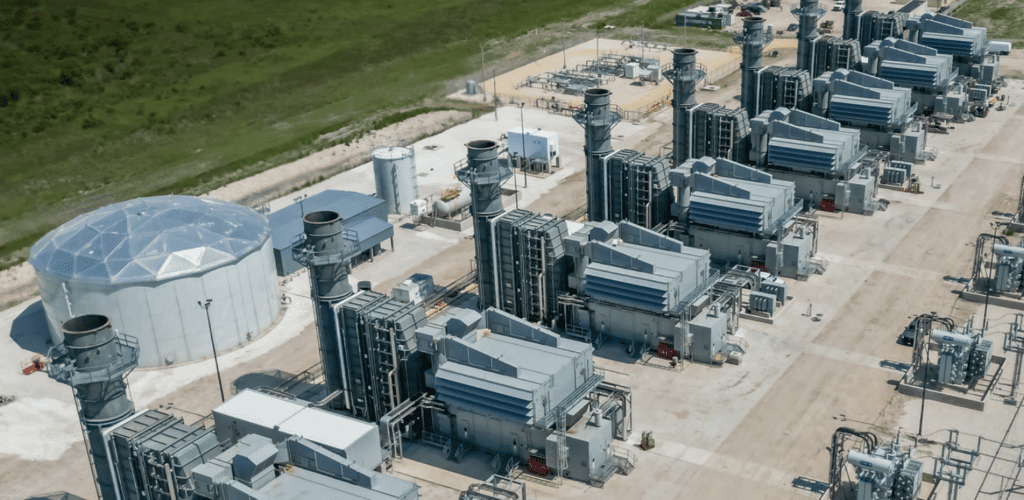
Not even a decade-old industry in the U.S., LNG feedgas has become a major driver of domestic gas demand since Sabine Pass filled its first cargo in 2016. Since then, eight more facilities have turned on the taps, with feedgas now averaging over 15 billion cubic feet per day (Bcf/d) year-to-date.
While these facilities have grown demand in the U.S., their impact on pricing has been somewhat muted. As facilities have been constructed, midstream companies have developed both greenfield and brownfield gas pipelines to bring new volumes from the Permian and Haynesville to the Gulf Coast, creating a semi-closed loop system from wellhead to export. LNG terminals have facilitated incremental production to come to market that may not have otherwise come online had it not been for the export terminals.
This trend is expected to continue with a host of new pipelines under construction. Collectively, these projects will be able to provide increased capacity into the greater Gulf Coast region to feed growing LNG feedgas demand.
Power Burn and Pricing Volatility
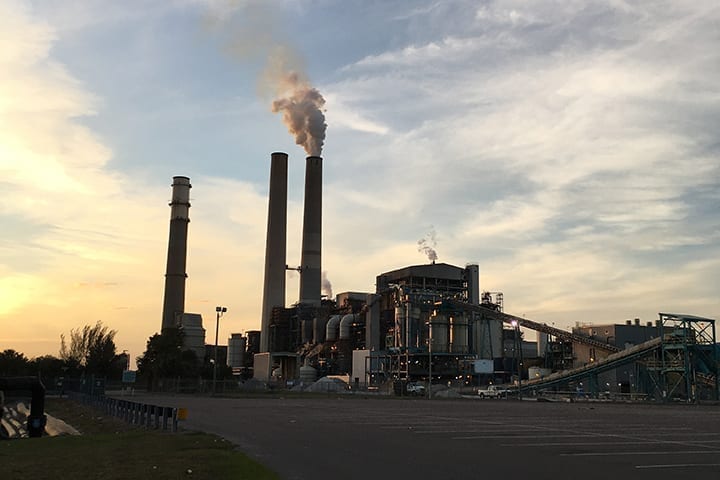
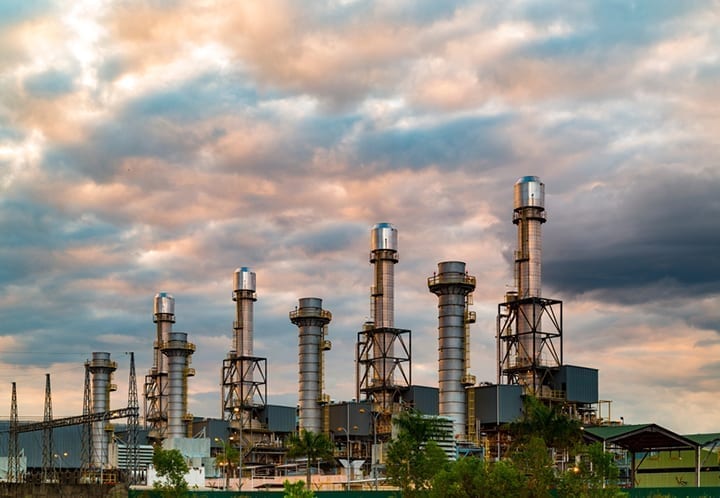
Gaining market share largely at the expense of coal, natural gas-fired power plants have become the predominant generation type in the U.S. Roughly 40% of U.S. coal capacity retired between 2010 and 2024 thanks to lower-cost gas generation. During that period, gas generation nearly doubled, becoming the marginal electron for most the country’s electric markets.

In This Issue
Full issueIn the past, the economic interplay between coal and gas generation functioned as a safety valve for U.S. gas markets. When gas prices climbed, generators switched away from gas and to coal, removing gas demand from the market and alleviating price pressure. However, as coal has retired, the magnitude of available gas-to-coal switching, and vice versa, has reduced over time, curtailing a key balancing item for gas markets. Now, when gas prices rise relative to coal, there is less optionality in markets to shift generation and alleviate price pressure.
This trend was seen most evident in 2022 when Henry Hub averaged $6.45/MMBtu not due to LNG, but due to power market dynamics and a slow rebound in production post-pandemic. As more than 13 GW of coal capacity rolled offline, a particularly hot summer saw load grow 3.3% year-over-year. With less coal capacity to switch to, power burn grew by 2.3 Bcf/d to meet the higher demand, which, in conjunction with post-pandemic producer discipline, resulted in the observed run in pricing with Henry Hub averaging $8.81/MMBtu in August 2022, a level not seen since August 2008.
Media outlets and industry participants were quick to point to the war in Ukraine and Europe’s increased reliance on U.S. LNG. But the reality of the situation was that U.S. LNG exports were, and still are, capacity constrained. While utilization was slightly higher than historical averages, excluding Freeport, the only real change on the U.S. LNG export front was a shift in cargoes from Asia to Europe.
The war did not, and has not, resulted in a substantial amount of incremental LNG cargoes leaving the U.S. Rather, it has led to more cargoes going to Europe at the expense of exports to Asia. The main driver for price volatility, power burn, was overlooked. Meanwhile, the intermittent nature of renewable power and the fledgling status of battery infrastructure can suddenly place additional onus on gas generators to balance the grid, leading to quick changes in the call on generating units, and driving day-ahead and intraday gas price volatility.
While rapid winter pricing swings remain a prevalent feature of gas markets in the 2020s, summer volatility has grown as well. Averaging 1.3% in the 2010s, summer pricing volatility has grown to average 3% so far this decade. At an annual level, Henry Hub reached a peak in volatility last year of 5% and is currently on track to nearly match this record again, averaging 4.6% for 2025 year-to-date.
As electrification and the data center buildout drive load growth over the coming years, price volatility is likely to remain a constant feature of the U.S. gas market dynamics as power burn continues its upward, and unpredictable, trajectory.
—Grant Gunter and Bailey McLaughlin are energy experts at PA Consulting.