Using Data Analytics to Improve Operations and Maintenance

Power plants are challenged to generate value from their data, but this can be a tedious and slow process, with uncertain outcomes. Now, as shown in these use cases, data analytic solutions can put innovation in the hands of process engineers and experts for rapid and useful insights.
Most power plants have tremendous amounts of data stored in their historians, asset management systems, and/or control and monitoring systems. Plant operations and maintenance can be greatly improved by turning this data into actionable information, but this has proven to be easier said than done for many plant operators, due to a variety of issues.
Because of long operating lifetimes, power generation plants can lag in the adoption of modern data analytic and other solutions to improve operations and maintenance. Many facilities still have what they started with in terms of automation hardware and software systems, based on the refresh cycle of their main control system.
A good example is the data analytics software plants use to improve operations and maintenance through root cause analysis, asset optimization, report generation, and more. The default data analytics approach in most plants today is the spreadsheet, the go-to tool for process engineers in every industry, and now more than 30 years old. While it provides unquestionable flexibility and power, this general-purpose tool lags in the innovations that have been introduced in information technology (IT) departments, and even in consumers’ lives.
In particular, one often sees frustration with older software solutions among younger employees who show up with a lifetime of computer experience, and wonder at the lack of innovation in the tools provided to them for data analytics. Spreadsheets and macros in a world of Google and Alexa just don’t make sense to this audience.
To compound the issue, there is more data to work with (Figure 1), more demand to get insights from data, and more technology—creating a gap between the status quo spreadsheet and the potential for improvement.
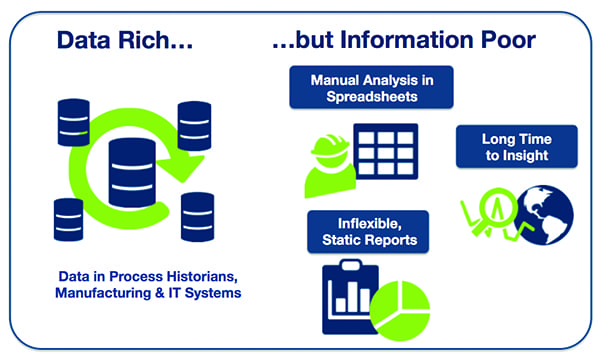 |
| 1. DRIP. Power plant personnel often find themselves drowning in data, but lacking in the information required to improve operations and maintenance. Courtesy: Seeq Corp. |
The data collection capabilities provided by process instrumentation, coupled with improved methods of networking and storage, have created an environment where companies accumulate vast amounts of time-series data from plant operations, labs, suppliers, and other sources. Together, these data sources contain potential insights into the operation and maintenance of virtually every major item of equipment and every important process in a typical power plant.
This article will use multiple examples to show how power plants are using data analytics to improve operations and maintenance, thus providing a road map for facilities looking to implement similar programs. But first, let’s look at some of the pressure points forcing power plants to start creating value from their data.
Deriving Value from Big Data
Realizing that all this data is available—and being bombarded with stories about how other industries are deriving value from big data—C-level executives and plant managers are demanding and expecting more insights, faster, to drive improvements in plant operations and maintenance. These improvements could be increased asset availability via predictive analytics, improving compliance through monitoring of key metrics, or simply greater productivity when accessing contextualized data as input into plans, models, and budgets.
This is the managerial burden of the “big data” era, where awareness of innovation has created pressure to take advantage of it. Unfortunately, full utilization of many of the big data solutions available today requires extensive programming expertise and knowledge of data science, to say nothing of IT and other department costs to implement and manage—resulting in high failure rates during implementation.
In addition, there are the waves of technology innovation that have dominated headlines in recent years including big data, industrial internet of things, open source, cognitive computing, and the cloud. As referenced earlier, we live in a consumer and IT world dominated by advanced user experiences. The difference between what we do every day when using Google, Amazon, and other modern experiences—and the spreadsheet-based analytics solutions available to engineers in power generation facilities—is painfully obvious.
Further, these consumer and IT experiences have closed the required experience gap in terms of usability, in addition to providing powerful functionality. Users don’t have to be a programmer to use Google or a data scientist to use Amazon Alexa, because these technology solutions are wrapped in easy-to-use experiences.
Beyond Spreadsheets to Modern Data Analytics
Examining these trends, it becomes obvious that it’s time for a new era in data analytics solutions for process manufacturing in general, and power plants in particular. The spreadsheet may live forever for some types of analysis, but there need to be better solutions for data analytics that go beyond the limited expectations defined by legacy software technology, with employees working alone to produce paper reports.
There are new technologies and solutions that accelerate machine learning to enable faster insights for improved process and business outcomes (Figure 2). These solutions bridge the gap among innovations, organizational needs, and access to insights by leveraging technologies like machine learning and web-based deployment, while remaining accessible to process engineers and experts. Figure 3 is an example of how big data can be visually depicted by data analytics software such that it is easily understood by engineers.
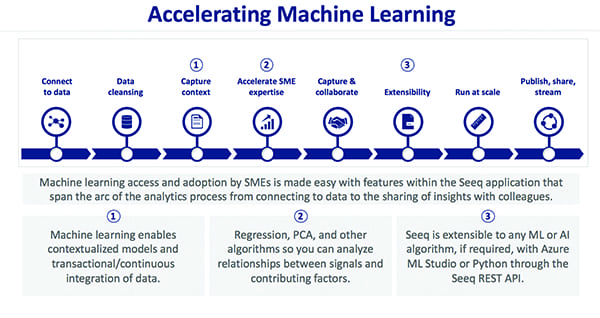 |
| 2. Accelerating machine learning. The right data analytics solution, in the hands of a process engineer or expert, can be used to accomplish all the steps needed to create and distribute actionable information. (SME = subject matter expert; PCA = principal component analysis; ML = machine learning; AI = artificial intelligence; REST = representational state transfer; and API = application program interface). Courtesy: Seeq Corp. |
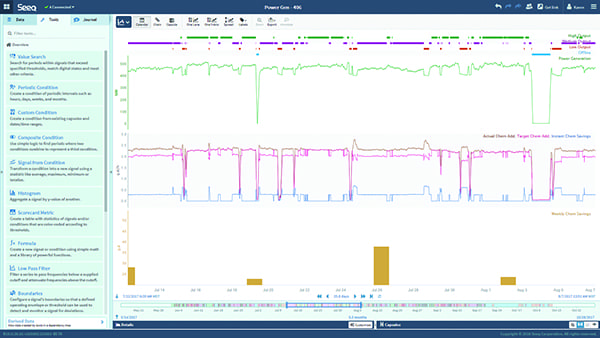 |
| 3. Observable trends. Creating value from big data requires direct and visual interaction with various data sources by plant engineers and experts, as shown in this Seeq screenshot. Courtesy: Seeq Corp. |
These solutions address organizational issues such as knowledge capture and collaboration to ensure access to and sharing of insights across teams or between plants. And by staying connected to the underlying data sources, they support both access to the right person at the right time, as well as the ability to drill down and link directly back into the source analytics and data. Even a PDF document, automatically generated as a report and distributed electronically, can hold links for simple yet powerful click-through to underlying data.
The use cases below demonstrate how the new generation of data analytics software can be used. This new class of software is differentiated by the impact of the insights, the ease of use, and the tools to collaborate with others in the organization.
Optimization of Emissions Treatment Chemicals
A large coal-fired power generation facility located in the Western U.S. faced a difficult task. Like most such plants, the facility was required to control its emissions, such as sulfur in the form of SOx, nitrogen in the form of NOx, mercury (Hg), and various carbon compounds. A facility of this type typically reduces emissions through a combination of capital investments (such as a scrubber, selective catalytic reduction [SCR] system, and fabric filter) and ongoing material costs (such as lime, NH3, specialty scavengers, and oxidizers)—as well as catalyst beds, filters, and sludge disposal.
Units often overtreat flue gas in order to ensure compliance, but this increases mitigant costs, and can result in reliability/longevity issues, contributing to high maintenance costs or even downtime. For example, some Hg mitigants are corrosive, and NH3 degrades the SCR catalyst, resulting in higher maintenance costs.
In this particular case, the plant was working in collaboration with its chemical vendor to control Hg using a new additive, calcium bromide, in place of activated carbon injection in the exhaust stream. The liquid calcium bromide was added to the raw coal before processing. Before the application of data analytics, the approach was to overfeed chemicals to ensure compliance, then to make conservative manual reductions to the application rate over a period of months and observe how emissions results were affected.
The plant received about five 400-gallon totes of calcium bromide per month, a total of about 20,000 pounds, at a cost of about $37,000 total. The additive was applied to the raw coal via a small pump mounted on a temporary skid.
The plant had a conservative internal average target value of 1.0 μg/m3 Hg in the emissions. When the plant was at full capacity, which was the preference, Hg hovered at or just above 1.0. When the plant was operating at medium and low output, the Hg emissions dipped down as low as 0.1.
Ideally, additive use would be adjusted at lower loads to the exact amount required, cutting the amount spent on the additive, and reducing the negative effect on mechanical integrity resulting from over-application of additive. This was not possible with the then-current system, because the additive feed rate was continuously adjusted per a linear relationship with coal feed rate, even though the effect of the additive on Hg levels in the stack was non-linear.
There was also a lag time between the addition of the additive and the effect on Hg levels, further complicating feed rate control. The problem wasn’t a big issue at the time, but was likely to become more troublesome in the future because the plant anticipated medium- and low-output conditions would occur more frequently.
Some key questions required answering in order to optimize additive feed rate. The questions were:
- ■ Does the pump feed rate zero when the curve (coal rate versus additive feed rate) goes below zero for chemical rate, or was a minimum rate maintained?
- ■ Should the pump be calibrated with a non-linear curve, or with separate linear curves for different regions of operations?
- ■ Was there a better way to optimize feed rate?
To answer the questions, data analytic steps were taken in a collaborative effort between plant and Seeq personnel. Seeq data analytics software was applied to data residing in the plant’s Ovation control system, just one of the many data sources for which Seeq provides direct connection.
The first step was to build a chemical addition pump-setting signal in gallons per hour, based on a linear relationship with the coal feed. This showed how well the pump settings performed based on what was learned in the data analysis, with the aim being optimization of the pump-curve relationship. Different conditions were created for the various chemical addition test periods as the pump settings were tweaked, and the results were spliced together over time, using the Splice function in the software.
Next, the power generation signal was queued up and the Value Search tool was applied to identify high-, medium-, and low-load conditions. Also using Value Search, conditions were identified when Hg was less than the 1.0 target.
The team then created composite conditions identifying when the chemical addition could be more tightly controlled. In this case, that was when the plant was at medium or low load, and stack Hg emissions were less than 1.0. Plant personnel were then able to quantify how much chemical was overfed to the system during medium- or low-load periods.
A ratio of the actual Hg emissions to the target was created, and then the percent difference was applied to the treatment chemical rate. In other words, if Hg was 30% lower than target, the assumption was that the chemical was being overfed by 30%. The final step was to aggregate and normalize the total volume of wasted Hg mitigant chemical during the target condition periods, totalized over various time periods at different pump settings when the chemical was being overfed.
The results were telling. Calculating the gallons of excess chemical fed during overtreatment periods showed that changes made to the pump setting reduced the over-application of chemical during medium-load condition rates by 50%. The plant expected to dip down into medium and low rates more in the future, so these chemical application rate optimizations were expected to become more valuable.
If the plant could save just one tote of chemical per month, it would equate to about $7,500 per month, or approximately $90,000 per year, in savings. Furthermore, the plant expected to conduct further optimization of the additive-emissions curve relationship for even finer tuning at medium- and low-load operations.
Use Cases in Brief
The following examples offer further evidence of the value of advanced data analytics.
Power Plant Data Analysis. A power plant performance manager had to compile a report for submission to the Federal Energy Regulatory Commission each quarter listing voltage overages. Finding these occasions using the control system’s historian meant reviewing data manually by examining it in 15-minute blocks over the 3-month period. Seeq was able to find such situations in an instant, even when the duration of the excursion was for merely a few seconds. Setting the selection criterion for such studies was very simple using Capsules, and a full report was prepared in minutes.
Power Plant Asset Optimization. Plant operators were aware that feedwater heaters tended to foul, creating degraded efficiency in a predictable manner. But, due to insufficient instrumentation, they were unable to quantify the process so maintenance could be optimized. Seeq analysis of the available boiler heat rate data provided the information necessary to determine what effect a cleaning effort had on efficiency, even to the extent of determining its specific value. As a result, operators are now able to optimize cleaning frequency based on a cost/benefit relationship.
These use cases show how modern data analytic solutions can be applied to quickly solve power plant operations and maintenance issues. In all cases, interactions were directly between plant experts and the data of interest, with no intervening actions required from data scientists or IT experts. This enabled an iterative and collaborative analysis of data by those in the best position to create information that can be used to improve plant operations and maintenance. ■
—Michael Risse is a vice president at Seeq Corp., a company building innovative productivity applications for engineers and analysts that accelerate insights into industrial process data.