Control loop performance-monitoring software can help to improve loop performance at electric power plants by automatically collecting data, assessing several aspects of loop performance, and providing the results in reports and user interfaces.
Power plant control systems must perform well to obtain maximum efficiency, reliability, regulatory compliance, and safety from a plant. Poorly performing controls can cause operational difficulties such as boiler oscillations, increased heat rate, accelerated equipment wear, increased emissions, slower load ramp rates, reduced generation capacity, steam temperature excursions, and unit trips following upsets.
To maintain optimum plant performance, control loop performance should always be tuned for maximum performance. This can be achieved only by monitoring loop performance and taking the appropriate corrective actions when poor performance is detected. However, the diagnosis and resolution of control loop problems are difficult, particularly in large and complex process facilities such as power plants.
Several control loop performance-monitoring (CLPM) software products have become commercially available over the past decade. These products automatically monitor the performance of control loops. They potentially identify several aspects of poor control and can generate a prioritized list of problem loops with diagnoses of the individual problems so that these can be corrected.
CLPM Software
Control loop monitoring solutions are available from distributed control system (DCS) vendors and third-party software companies, including ABB, AspenTech, Capstone Technology, Control Arts, ControlSoft, Control Station, Emerson, ExperTune, Honeywell/Matrikon, PAS, and RoviSys. The products vary in the range of analyses they perform, presentation of results, reporting features, and data collection methods, but they all aim to identify and report on poorly performing control loops. One such software product, PAS PSS Loop Analysis, was tested by the Electric Power Research Institute (EPRI) and Southern Company on Alabama Power’s Plant Gaston Unit 3.
Although there are differences in the features and presentation methods from one CLPM product to another, most provide the following core functions:
- Automatically collect process data for analysis.
- Assess the dynamic performance of control loops.
- Diagnose loop performance problems.
- Represent loop performance with a set of metrics.
- Aggregate loop performance metrics into high-level key performance indicators (KPIs).
- Present loop performance in user interfaces and/or reports.
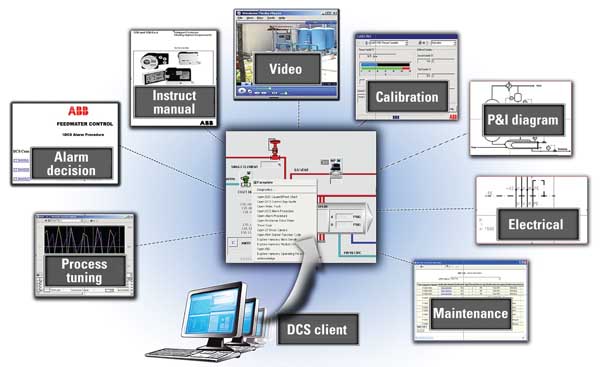
The first requirement for monitoring the performance of control loops is access to uncompressed process data sampled sufficiently fast to capture the loop dynamics (Figure 1). A good way of collecting process data for loop monitoring is through object linking and embedding for process control (OPC) with real-time data access (DA) because it is supported by all modern control systems, and it gives the loop-monitoring software the most control over sampling rate and data resolution. Careful consideration should be given to the rate at which loop performance assessment software acquires data from the data server to avoid overloading it.
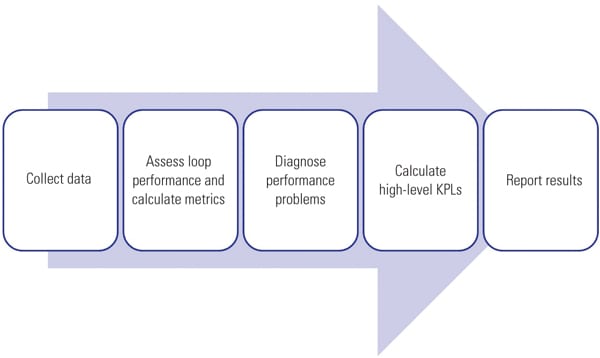 |
| 1. Keeping things under control. The basic steps in control loop performance monitoring are shown. Courtesy: OptiControls Inc. |
To improve network security, most plants segregate process control computer systems and regular users into individual networks separated by firewalls. Process data has to flow from the process control network to the application servers, and client computers must have access to connect to these software applications. Software vendors provide various data connectivity solutions to get process data to their application servers and application data to their users.
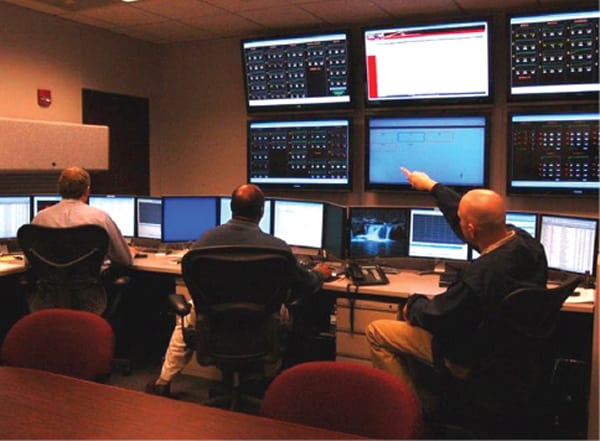
Because CLPM software will likely have multiple users, a client-server architecture is essential. The server is responsible for collecting data, running the analyses, historicizing the results, sending out scheduled reports, and delivering performance results on request from client applications. The client applications can be used by engineers, technicians, and managers distributed throughout the enterprise. Some plants require web browser access for viewing plant data and reports to minimize the need for software installations and upgrades on client machines.
Analyzing Loop Performance
Loop performance should be assessed from various perspectives. For example, a control loop has to run in automatic control mode, be stable and responsive, and reduce process variability. Each aspect of loop performance can be expressed as a metric. The metrics can be compared to thresholds for proper loop performance. If one or more metric exceeds its threshold, the loop can be flagged as having poor performance and the offending metric(s) can indicate the reason. Maintenance or engineering staff can then attend to the problem. Some loop performance metrics are based on simple statistical calculations; others require complex algorithms based on time-series and frequency-domain analysis.
The following metrics are essential for assessing the performance of the control loop, but CLPM packages provide many more:
- Percentage of time the controller is not in its correct mode (or in manual)
- Controller responsiveness to setpoint changes and disturbances
- Tendency of loop to oscillate
- Percentage of time the controller output is at its limits
- Standard deviation in error
- Measurement noise
- Maximum deviation from setpoint
Once the various individual metrics of control loop performance have been calculated, they should be combined into a single number representing the overall control loop health. In this way the performance of all loops can be compared, and the loops can be ranked in order of performance so that loops requiring attention are easy to find. An important part of control loop performance monitoring is providing a diagnosis when poor performance is detected. Process control engineers and technicians can use the diagnosis to decide on the appropriate type of corrective action such as tuning or mechanical maintenance.
Power plants use advanced regulatory control strategies much more than other large industries. These include cascade, feedforward, override, ratio control, gain scheduling, and linearization. It would be helpful if loop performance-monitoring applications also evaluated the design of these control strategies and provided a more targeted corrective action. However, not all CLPM software packages assess the performance of advanced control strategies.
Thermal power plants may cycle through daily load changes and have different burners in service and burn coal of varying quality. Loops may respond differently under different operating conditions. For example, steam temperature control may be stable at full load but oscillate at low load. CLPM software should have the ability to detect different operating conditions and associate them with the periodic performance assessments. Furthermore, power plants typically have equipment in standby mode, such as boiler feedwater pumps and mills or equipment used for intermittent operation, such as sootblowers. Loop assessment software must be able to detect the equipment state and assess the loop only if the equipment is operating.
Diagnosis of control problems is an important feature but has the potential for confusion. If a control loop has an issue for which the severity is at the threshold of detection, the software can report this problem intermittently as operating conditions change from one assessment period to the next. If a loop has more than one issue like this, its performance history could sometimes indicate one problem, other times another, and sometimes none. This can be confusing to a user who is looking for a single, unambiguous path to resolving the problem.
It is often difficult to find the root cause of process oscillations on highly interactive processes. There is a two-phased approach to addressing this problem: First, all the loops affected by the oscillation must be identified, and then the foremost leading loop must be identified. Some CLPM software packages have multivariant interaction analysis that can potentially help to identify all the loops affected by a common oscillation and pinpoint the cause. Although the software might be useful for this purpose, the evaluation team’s experience was that plant knowledge and human analysis were also required to pinpoint the cause.
For monitoring control loop performance in the long term, it is useful to have aggregated loop performance metrics such as the number of loops in manual or the average performance index of all control loops. KPIs can be used for this. For control performance, KPIs can be a unit- or plant-level aggregation of the performance of individual control loops.
User Interface
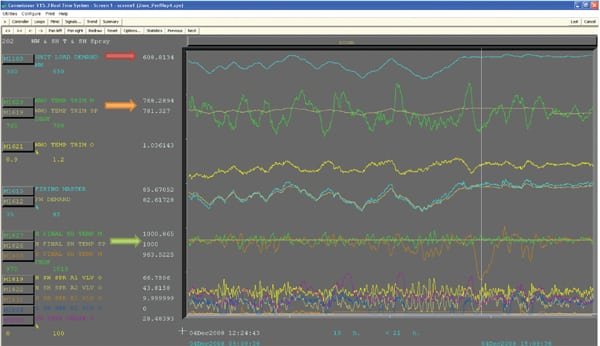
The actual loop performance analyses are very complex, and it is important that CLPM software hides this complexity from the user. Loop performance results should be presented in a clear and intuitive way, with easy-to-use navigation and drill-down capabilities. Several task-oriented user interfaces with easy navigation between them and drill-down is ideal (Figures 2, 3, and 4), for example:
- A tree map with colored rectangles for displaying the loop performance (in color) and loop importance (in size) in a hierarchical structure.
- A grid for displaying all the performance metrics of all the loops and providing sorting and filtering capabilities.
- A window to display the data that was used for an individual loop’s performance assessment, as well as statistics and metrics.
- A historical plot of loop performance and metrics over time.
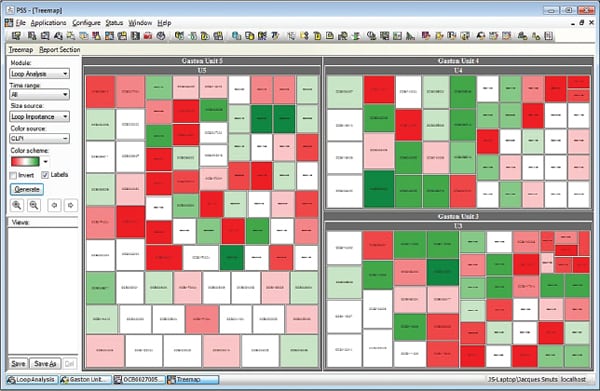 |
| 2. The tree of knowledge. The tree map depicts individual loops with control performance indicated by color and loop importance indicated by block size. Courtesy: Control Loop Performance Management screenshots used with permission from Plant Automation Services Inc. |
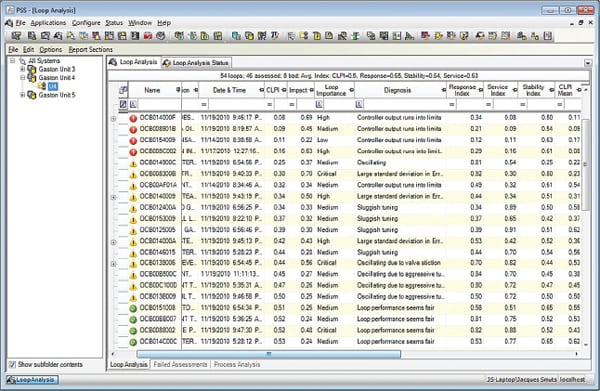 |
| 3. Tracking down trouble. The CLPM software organizes loop performance metrics and displays them in a grid that can be filtered and sorted to narrow down and detect specific problems. Courtesy: Control Loop Performance Management screenshots used with permission from Plant Automation Services Inc. |
 |
| 4. Performance review. The CLPM software displays the actual data and associated metrics used for assessing a loop’s performance. Courtesy: Control Loop Performance Management screenshots used with permission from Plant Automation Services Inc. |
Interactive use of loop-monitoring software is essential for mining information through ad-hoc navigation, drill-down, data sorting, and custom filtering. But for a periodic overview of loop performance, targeted reports are far more efficient. Ideally, performance-monitoring software should have prepackaged reports; however, it should allow customization of these reports and the creation of new ones. Reports or links to reports should be transmitted to users via email.
Installation and Configuration
Multi-component software should come with an option-based installation program that allows the user to install different components of the CLPM system onto different machines and networks. After installation, communication must be established among all the distributed components. Both of these activities are quite specialized, and it is recommended that the software vendor or an authorized agent install the software and establish communications.
Once the software has been installed, a list of control loops in the DCS must be obtained and loaded into the software’s own database. In addition to a list of loops, the data connection points (OPC addresses) for the loop’s setpoint, process variable, controller output, mode, and proportional/integral/derivative settings are needed. Additional information such as the desired settling time, control objective, control strategy, type of process, and the like may also be needed. This information can potentially be loaded into the software by configuring a spreadsheet with all the loops and importing it into the CLPM software.
Another option is that the software can import the loop list directly from the DCS configuration files or database. If the control system does not have an automated way of generating a list of control loops and data addresses, manual configuration of these databases can be very time-consuming and prone to error.
Because control loops have different objectives and operating constraints, CLPM software should provide adjustable parameters to cater to the function and process environment of a loop. Initially, the CLPM software might come with default settings. Using these can result in the software falsely reporting problems, or missing poor performance. To improve the accuracy of loop assessments, the adjustable parameters should be set in accordance with each loop’s control objectives and operating constraints. A person with a high level of technical expertise in control loops, the process being controlled, and the monitoring software is required to perform this calibration.
Once the loop assessment software has been calibrated, an instrumentation and control technician should be able to use the tree map to find problem loops, drill down to obtain the diagnoses and corrective actions, and use a tuning application to solve tuning problems, or submit a work order for other maintenance.
Benefits of Loop Performance Assessment Software
Although it might be difficult to establish a dollar value for the return on investment, many benefits are associated with the information, analysis, and diagnoses provided by control loop performance-monitoring software.
For example, as older, experienced workers retire, they are inevitably replaced by younger workers who have less experience. CLPM software can be useful to less-experienced process control engineers and technicians by helping them differentiate between good and poor loop performance and helping them diagnose the causes of poor loop performance.
There are several additional ways in which loop performance assessment software can improve work processes, raise efficiency, and save time. These are described in more detail below.
Assessing Loop Performance Automatically. A typical coal-fired power plant has several hundred control loops. CLPM software assesses the performance of hundreds or thousands of control loops without the need for human intervention. The software can identify poorly performing control loops so that these can be attended to.
Prioritizing Bad Actors. A loop may be performing poorly, but if it is not an important control loop, it should not be worked on if more important loops are also performing poorly. Loops that are important and also performing poorly should be worked on first. When CLPM software considers both the performance and the importance of control loops, it can provide a prioritized list of poorly performing loops.
Diagnosing Control Problems. CLPM software not only indicates which loops have poor performance, but it also attempts to give a diagnosis of why the performance is poor.
Providing Guidance on Problem Resolution. CLPM software can provide steps for validating the diagnosis and resolving the problem. This is vital information for the non-expert.
Maintaining Performance and Tuning History. CLPM software can maintain history related to several aspects of control loop performance and controller tuning settings. These settings can be trended over time to see the effect of tuning changes on loop performance. It is helpful to see at what point in time the tuning settings were changed, what the old values were, what they were changed to, and what effect the changes had on loop performance, loop stability, and standard deviation in error.
An Aid in Boosting Loop Performance
CLPM software can be tricky to install, connect, and configure, so obtaining support from the vendor or an agent is advisable. The tweaking of loop assessment criteria is required to take into account the specific objectives and operating constraints of each loop.
Once the system has been properly configured, however, it can draw attention to poorly performing loops to help support a loop optimization program.
Pilot installation of the software is valuable in that it helps to identify potential value and problems, thus enabling more informed decisions before broader deployment.
— Jacques F. Smuts (jsmuts@ opticontrols.com) is the founder of OptiControls Inc., in League City, Texas. John N. Sorge (jnsorge@southernco.com), Dale P. Evely (dpevely@ southernco.com), and Mark Faurot work for Southern Company, Birmingham, Ala. Aaron Hussey (ahussey@epri.com) works for the Electric Power Research Institute, in Charlotte, N.C.