A digital twin designed for the Atikokan biomass power plant uses science-based Bayesian machine learning methods combined with surrogate models developed from a suite of validated, multi-physics simulations to optimize boiler operation. It has proven highly effective, with efficiency increases of as much as 6.1% and average NOx emissions decreases of up to 47.0% compared to as-operated firing.
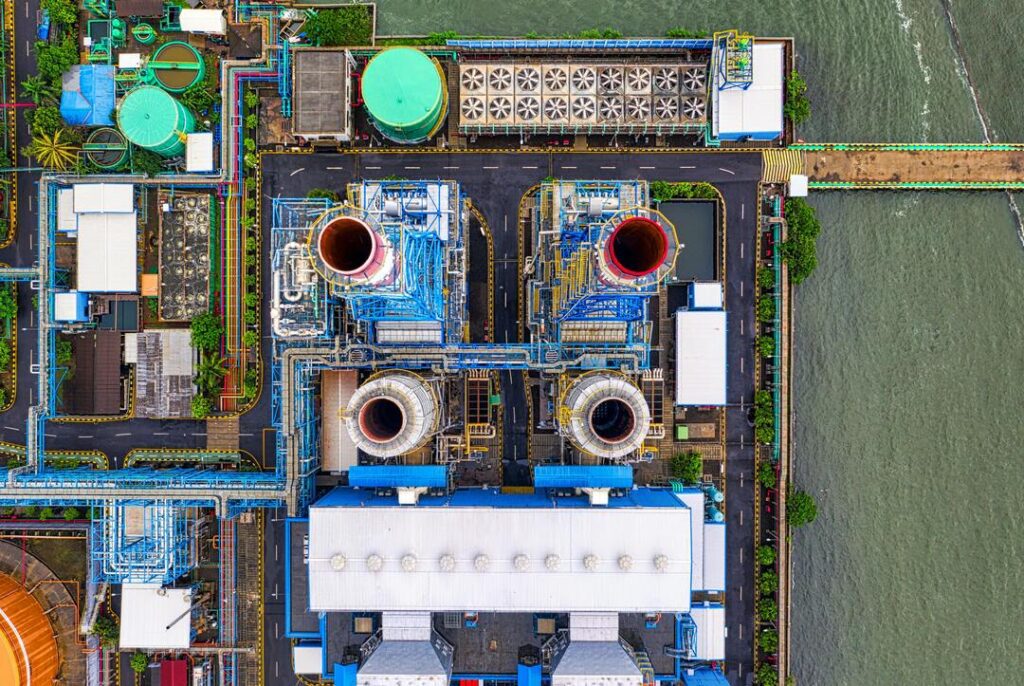
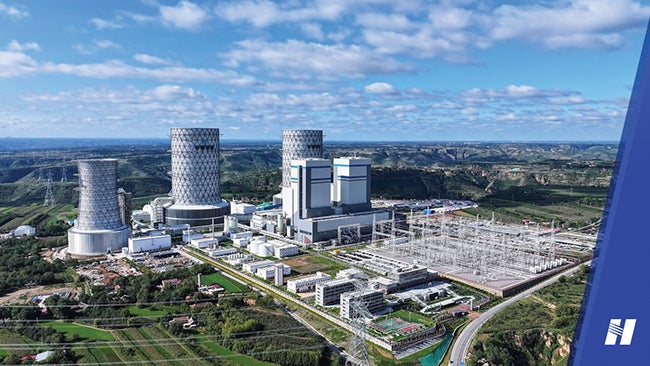
The 227-MW Atikokan tower boiler, fired with white wood pellets, is located in Atikokan, Ontario, Canada, and is owned by Ontario Power Generation (OPG). The plant, originally fired with lignite coal, was converted to fire 100% biomass (2012–2014) and became fully operational with biomass in September 2014. Unit operation varies from 40 MW to 200 MW, with generally only two of five mills in operation, generating 40 MW to 100 MW. Each mill provides fuel to one level of burners; there are five levels in all with three burners per level.
Operation at low loads results in a number of challenges. In particular, the station has worked to optimize burner performance, limiting the need for auxiliary fuel support. In addition to some key equipment modifications, station staff have employed the selective use of burner row combinations and operational settings to improve performance within the challenging low-load regime. The application of a digital twin concept that includes machine learning was a natural fit to assist with this work.
First-Class Tools and Technology
The Atikokan digital twin was developed at the University of Utah’s Carbon-Capture Multidisciplinary Simulation Center (CCMSC), which was established in April 2014 by the U.S. Department of Energy’s National Nuclear Security Administration (NNSA) for the purpose of solving large practical problems. To accomplish this mission, a multi-physics, large-eddy simulation (LES) code (Arches/Uintah) was developed. To guide the application, the center partnered with OPG to develop a digital twin for its Atikokan Station. The Atikokan unit was the first suspension-fired power generation boiler in North America to completely convert from coal to carbon-neutral biomass firing.
The Atikokan digital twin starts with a suite of validated, multi-physics simulations. These simulations were selected from a design of experiments covering the full potential operational space for the boiler. This suite of Arches/Uintah simulations was then abstracted into surrogate models for all quantities of interest (QOI). The digital twin uses science-based Bayesian machine learning (ML) methods to combine these surrogate models with online power plant measurements to produce real-time (three to five minute updates) operational setpoints for continuous optimization of the Atikokan boiler. A demonstration of the digital twin can be accessed online at: bit.ly/Atikokan.
In recent years, coal has fallen further out of favor as a thermal fuel for power generation. With the search for carbon-neutral electric power generation, many countries, including the U.S., are turning to biomass, a carbon-neutral fuel, as an alternative to fossil fuel sources. OPG, one of the few utility companies in North America to have completely eliminated coal-fired electricity from its generation portfolio, agreed to join the Utah Center to provide experience, data, and a platform (the Atikokan Power Station) for the demonstration of the digital twin. The digital twin focused on the lower power generation range resulting from operation with only two mills (or two burner levels) at a time.
High-Performance Computing Simulations
Boiler simulations were performed in 420 specific operating states determined by a design of experiments. OPG provided geometry specifications (such as size and location of the tube banks, and type and location of the burners), heat transfer characteristics (such as tube wall thermal conductivity and tube wall temperature), and operating data (including biomass flowrate, air flowrates, air temperatures, three measurements of oxygen at the boiler outlet, net power, gas temperature prior to the convective zone, and several water and steam temperatures). Additionally, OPG provided a biomass fuel sample from which physical properties (including particle size distribution and particle true density) and chemical properties (such as proximate analysis, heating value, and ash composition) were determined that were needed in the simulations.
To reduce the time for simulation outputs in the digital twin from days to fractions of a second, surrogate models were used that were created from data extracted from the suite of 420 simulations. To determine this suite, six operating parameters were considered for each two-mill pair (or two-burner level). The computational resources required that the degrees of freedom be limited to four: total biomass flowrate (assume equal split between levels), total secondary air flowrate (assume equal split between levels), tramp air split (percent of secondary air fed through burners not firing biomass), and percent flue gas recycle (FGR) back into the boiler. Based on OPG data, the operating range for each of these four parameters was determined and an optimized design (42 samples) in this four-dimensional space was performed.
The set of simulation output data required for the digital twin grew over time to include 60 variables grouped into three general categories:
- Variables Measured at the Plant. O2 outlet concentration, gas temperature at the top of the boiler and at the outlet, net power, and flame scanner signal strength (15 total, one per burner).
- Variables Needed for Constraint and Optimization of the Digital Twin Based on Feedback from OPG Personnel. CO concentration at the top of the boiler and at the outlet, NOx outlet concentration, and maximum surface temperatures of tube banks in the boiler and in the convective pass.
- Other Variables of Interest. Wall heat flux profile (20 total), mass deposition on walls, and total flue gas flowrate.
An instrument model for each type of data was developed. For example, the gas temperature at the top of the boiler was computed by averaging the temperatures along a line of sight through the computational domain. The outlet species concentrations were determined by averaging across the outlet plane. The flame scanner data were extracted as the radiative intensity arriving from the orthogonal direction at a location just above the burner inlet. All data were averaged over an appropriate simulation time.
For visualization purposes, three-dimensional images were generated that span the range of variables and visualization types: slice (horizontal and vertical), surface (on all surfaces within the boiler), and volume (volume-rendered image of entire domain or with two cutting planes through the domain). This “Simulation Visualizer” is part of the digital twin and can be accessed online at: bit.ly/Atikokan.
Validation and Uncertainty Quantification
The digital twin uses science-based Bayesian machine learning (ML) methods to combine the surrogate models with plant measurements to update the model and scenario parameters to produce a dynamic, science-based predictive tool that updates as the plant evolves. For the Atikokan digital twin, the machine learning technology receives 129 inputs from plant operations every five minutes. It then takes the last 24 hours of data (37,000 inputs) to learn the new state of the predictive science–based model.
This is a Bayesian inverse problem, not a data-fitted neural network. The digital twin uses formal decision theory in the presence of the learned uncertainty to optimize the operational setpoints for the objective function(s) subject to the operational constraints. This decision theory takes advantage of both a cost function and a utility function that accounts for the level of risk the plant is willing to take given the uncertainty in the system. The optimization is performed every three to five minutes matching the rapidly changing power dispatch. The digital twin produces 106 outputs with uncertainty distributions for each of the 10 level pairs for a total of 1,060 outputs every five minutes. These are the optimized outputs from the twin and thus the inputs to the plant from the twin.
A unique feature of the digital twin is that it is continuously learning simultaneously from experimental data as well as from the hierarchically validated, science-based, high-performance computing Arches/Uintah model. Thus, the digital twin is more than a virtual representation that serves as a real-time digital counterpart of a physical object or process; it is also predictive. Our abstraction for a digital twin is to bring together science-based models with measurements from the physical twin, to not simply produce a control algorithm, but to predict what the setpoints should be to achieve continuous optimization of the unit and to do so in the presence of uncertainty. The digital twin provides not only the continuously optimized quantities of interest, but also the continuously learned uncertainty in those quantities.
For the initial development project, the digital twin was performed offline for plant data from December 2019 and then applied to any set of operating conditions to produce the predictive evaluations. This “Offline Integration” tool can be accessed online at: bit.ly/Atikokan. The user may query the ML with a series of sliders for any set of operating conditions within the operating space of the design of experiments described above.
Optimization with Artificial Intelligence
One of the key lessons learned from interactions with OPG personnel is that uncertainty itself has little value to decision-makers unless the tools to make decisions—to optimize in the presence of uncertainty—are coupled with the uncertainty analysis itself. This is the objective of the digital twin: to perform calculations in real-time using the surrogate model, and the results from the Bayesian analysis, to make predictions with uncertainty, and to incorporate formal decision theory to provide optimized decisions that account for the uncertainty.
The optimization is performed with the use of a cost function. The cost function translates the physics QOI (power, NO x concentration, deposit thickness, etc.) to a value useful to the decision-maker (cost). This cost function is defined in collaboration with OPG and includes the constraints on the decision.
However, the cost function alone is not the final function that is maximized. As E.T. Jaynes wrote in the book Probability Theory: The Logic of Science, “An essential thing which is still missing… is the rule by which it converts its final probability assignment into a definite course of action.” This utility function incorporates the risk aversion propensity of OPG personnel. For the Atikokan digital twin, this process is summarized as defining a cost function for a given risk aversion that will:
- Generate a given power output (such as 64 MW).
- Maximize boiler tower efficiency.
- Find the input operating parameters including firing level pair, total biomass fuel feed rate, total secondary air feed rate, total tramp air split, and flue gas recirculation damper position.
- Subject to the output constraints including power produced within 5 MW of dispatch load, six flame scanners reading >70% for all burners firing biomass, mole fraction O2 at the outlet >1.5%, mole fraction CO at the outlet <200 ppm, all tube metal temperatures.
This artificial intelligence (AI) methodology is demonstrated for the Atikokan digital twin in the “Online Optimization” tool, which can be accessed online at: bit.ly/Atikokan. This boiler is required to change load on a five-minute dispatch. The data show all of the two-level firing modes dispatched for the Atikokan boiler in the month of December 2019. The results show the actual conditions and the optimum operating conditions recommended by the digital twin for each five-minute dispatch.
 |
|
1. Atikokan digital twin wood mass flowrate on Dec. 3, 2019, at 5:40 p.m. Plant personnel chose to fire biomass on levels 2 and 3 (L23). The optimum profit would have been achieved at the time by firing on levels 2 and 5 (L25). Courtesy: Ontario Power Generation (OPG) |
For example, on December 3, 2019, at 5:40 p.m., the Atikokan boiler was dispatched to produce 100 MW. Figure 1 shows the actual biomass wood firing rate at the power plant (natural gas was also fired), the equivalent firing rate of wood plus natural gas, and the optimum wood firing rates (no natural gas) for each of the 10 possible operating level pairs as identified by the digital twin. Power plant personnel chose to fire biomass on levels 2 and 3 (L23). The color represents the profit in operating at a given set of conditions with the overall optimum achieved by firing on levels 2 and 5 (L25).
 |
|
2. Atikokan digital twin boiler tower efficiency on Dec. 3, 2019, at 5:40 p.m. The goal of this function is to maximize efficiency subject to constraints. Courtesy: OPG |
Given the wood firing rates shown in Figure 1, the Atikokan boiler tower efficiency is shown in Figure 2 for the current and optimum operating conditions for each level-pair. The objective function for the optimization is to maximize this efficiency subject to the constraints.
While the overall maximum efficiency is achieved by firing on L45, under no operating conditions can all the constraints be met as shown by the profit for this level pair. Specifically, the six flame scanners are not predicted to read above 70% under any operating conditions. The overall optimum that meets all constraints within what is known about the uncertainty can be achieved by firing on L12, L25, L34, or L35.
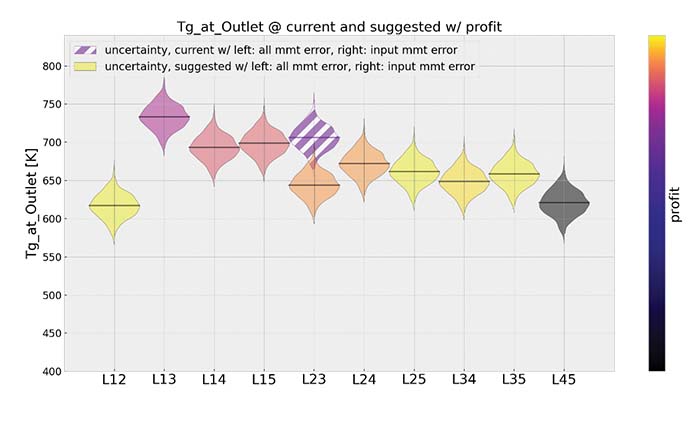
One of the key achievements as part of the development of the digital twin was to not only quantify the overall uncertainty in each QOI, but to produce a methodology that identified the source of these uncertainties. For example, consider the flue gas temperature at the outlet of the Atikokan boiler shown in Figure 3 for the current and optimum operating conditions for each level pair. For this QOI, there are continuous measurements made at the plant. Using these data and the errors-in-variables approach in the Bayesian analysis, the sources of uncertainty due to simulation scenario parameters can be identified.
 |
|
3. Atikokan digital twin flue gas outlet temperature on Dec. 3, 2019, at 5:40 p.m. The goal of this function is to maximize efficiency subject to constraints. This analysis shows that the accuracy of the outlet temperature prediction is controlled more by the inaccuracies in the measured scenario parameters than anything else in the simulation. Courtesy: OPG |
The distribution on the left side of each violin plot in Figure 3 shows the temperature uncertainty at the outlet produced from all sources, while the distribution on the right side of each violin plot shows uncertainty in the outlet temperature produced only from scenario parameters. From this analysis, the accuracy of the outlet temperature prediction is controlled more by the inaccuracies in the measured scenario parameters than anything else in the simulation. Thus, improving model form will not further improve the accuracy of the predicted outlet temperature.
 |
|
4. Atikokan digital twin flue gas optical “nose” temperature on Dec. 3, 2019, at 5:40 p.m. The measurement error in the observed “nose” temperature dominates the uncertainty. Courtesy: OPG |
Figure 4 further illustrates the information gained by the errors-in-variables analysis. This figure shows the predictions of, and uncertainties in, the flue gas temperature inside the boiler at the “nose”—the location where the flue gas enters the convection section.
Here the flue gas is hot and temperature measurements are hard to acquire. The plant uses an optical instrument to continuously measure the average temperature. The distributions on the left side of the violin plots in Figure 4 show the measurement uncertainty in the optical instrument, whereas, the distributions on the right of each violin plot show the uncertainty arising from scenario parameters. Thus, the measurement error in the observed “nose” temperature dominates the uncertainty.
As the optimum boiler operating conditions are dependent on the selected objective functions, the digital twin can be used to compare profitability as a function of various objective functions. For example, the data shown in Figure 1 have two objective functions. The first is power level (that is, obtain the dispatched power requirement), and the second is boiler efficiency.
 |
|
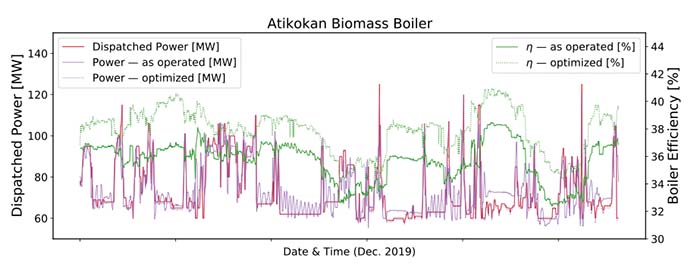
5. Atikokan boiler efficiency comparison for the month of December 2019 between as-operated conditions with the digital twin–optimized operation at the same burner level and the total digital twin–optimized operation. Averaging these efficiency data over the entire month shows that a 1.5% improvement was noted using existing burners in service and a 6.1% improvement was observed with optimal burners and operating conditions. Courtesy: OPG |
Weighting factors are applied to each objective function depending upon priorities. In this case, the power level is given a 40% weighting factor (as there is some small variability acceptable) and the boiler efficiency is given a 60% weighting factor. Thus, Figure 5 compares the boiler efficiency under the as-operated conditions for the month of December 2019 with both the boiler efficiency that could have been achieved firing with the same burners but with optimal operating conditions, and the efficiency that could have been realized had the boiler been operated with the optimum burners in service and optimum operating conditions. Averaging these efficiency data over the entire month of operation shows that a 1.5% improvement was noted using existing burners in service and a 6.1% improvement was observed with optimal burners and operating conditions.
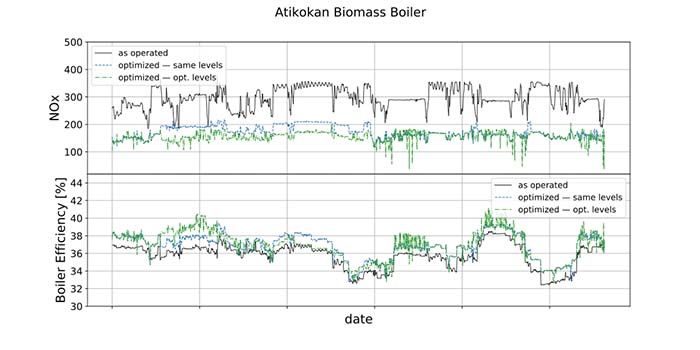
Suppose that low NOx emissions were equally important as boiler efficiency. The weighting factors now become 40% boiler load, 30% boiler efficiency, and 30% NOx emissions. The Atikokan digital twin reoptimizes operating conditions and burner levels to meet these new objective function constraints.
 |
|
6. Atikokan boiler efficiency and NOx emissions comparison between as-operated conditions with the digital twin–optimized operation at the same burner level and the totally optimized operation. Courtesy: OPG |
The results are shown in Figure 6. Notice now that there is only a 3.4% average increase in boiler efficiency when firing at optimum burner levels and firing conditions compared to as-operated conditions. However, with that 3.4% average increase in efficiency comes a 47.0% average decrease in NO x emissions compared to as-operated conditions. Thus, the number and choice of ultimate objective functions are crucial to optimizing the operation of the boiler.
A Successful Demonstration
OPG’s Atikokan power station is a 227-MW, opposed-wall-fired, wood pellet biomass plant that is required to run at very low loads (about 50 MW). Under these conditions only two burner rows are in service. Operational options include the amount of air in the out-of-service burners, amount of recirculated flue gas, and amount of excess air. An online digital twin has been developed for the purpose of optimizing operating conditions to minimize operating costs for electric power generation under dynamic low-load (40 MW to 100 MW) conditions at Atikokan.
This objective has been achieved through a Bayesian machine-learning (ML) and decision (AI) model that is continuously updated by combining offline data from high-performance computing, physics-based large-eddy simulations, and online data from the power plant’s distributed control system. The physics-based, biomass boiler model (Arches/Uintah) has been developed from a formal hierarchy of targeted validation experiments ranging from bench-scale furnaces through pilot-scale pulverized-fuel rigs to full-scale (1.2 GW) utility boilers.
The advantage of this digital twin model is that it can be used to predict highly resolved, validated quantities of interest from first principles that cannot be measured. This model is then used to create surrogate models to span the range of the operational space for the Atikokan station. These surrogate models take seconds to run in the online digital twin. The Atikokan digital twin has been demonstrated in a pseudo-online mode using dynamic plant data collected from the month of December 2019. In the end, the Atikokan digital twin demonstrated that:
- Bayesian physics-based AI introduces a method to improve operator decision-making by quantifying bias and from first principles that would be inaccessible to AI methods which use experimental measurements alone.
- Computational expenses associated with offline large-scale simulations are mitigated by the ability of the physics-based machine learning to deliver quantities of interest that cannot be measured directly.
- Continuous optimal operations are achievable by merging physics-based models with Bayesian decision theory.
Using the Atikokan digital twin in a pseudo-online mode with plant data from December 2019, comparisons were made showing operating conditions resulting from the optimization of various objective functions. When optimizing only on boiler efficiency, an average efficiency increase of 6.1% was noted compared to as-operated firing. However, when optimizing equally on boiler efficiency and NO x emissions, the average efficiency increase dropped to 3.4%, but the average NO x emissions decrease was 47.0% compared to as-operated firing. The Atikokan digital twin is anticipated to be fully installed and operational by the end of 2021.
—Philip Smith (philip.smith@utah.edu) is a chemical engineering professor at The University of Utah, Les Marshall (les.marshall@opg.com) is a senior technical officer with Ontario Power Generation, and Stan Harding (n.stanley.harding@gmail.com) is principal of N.S. Harding and Associates.