Costs for wind and solar power systems have been declining for years thanks to technology improvements, economies of scale, and fierce competition in auctions. In the second half of 2019, the levelized cost of electricity (LCOE) for solar PV was about 83% lower than a decade earlier, while costs for onshore and offshore wind were down 49% and 51%, respectively, according to Global Trends in Renewable Energy Investment 2020, a report commissioned by the United Nations Environment Programme’s (UNEP’s) Economy Division in cooperation with Frankfurt School-UNEP Collaborating Centre for Climate & Sustainable Energy Finance and produced in collaboration with BloombergNEF (BNEF).
LCOE Tells a Story
LCOE is a common measure used to evaluate the overall competitiveness of different generating technologies. It represents the average revenue per unit of electricity generated that would be required to recover the costs of building and operating a generating plant during an assumed financial life and duty cycle. Key inputs for calculating LCOE include capital costs, fuel costs, fixed and variable operations and maintenance costs, financing costs, and an assumed utilization rate for each plant type.
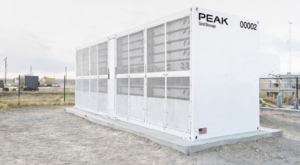
BNEF reported in late April that the global benchmark LCOE for onshore wind and utility-scale PV had fallen 9% and 4% since the second half of 2019 to $44/MWh and $50/MWh, respectively. Meanwhile, it said, the benchmark LCOE for battery storage had decreased to $150/MWh—about half of what it was two years earlier.
Other research suggests costs are even lower. Lazard, a financial advisory and asset management firm that has been publishing LCOE data annually for many years, said in its most-recent report (published in November 2019) that the cost of generating electricity from onshore wind and utility-scale solar projects decreased 3.5% and 7.0%, respectively, compared to 12 months earlier. It said when government subsidies were included, the cost of building new onshore wind and utility-scale solar averaged $28/MWh and $36/MWh, respectively. Furthermore, Lazard’s analysis showed new onshore wind and utility-scale solar was competitive with the marginal cost of existing coal and nuclear generation, which averaged $34/MWh and $29/MWh, respectively.
The U.S. Energy Information Administration (EIA) also published LCOE data earlier this year. In a paper released on Feb. 21, 2020, EIA estimated the capacity-weighted LCOE for new generation resources entering service in 2025 (in 2019 dollars) would be $34.10/MWh for onshore wind and $30.39/MWh for solar PV. Although state and local incentives were not included in those calculations, the EIA did include a levelized tax credit of –$2.41/MWh for solar PV in its figures. For comparison sake, the average LCOE for natural gas combined cycle plants was estimated to be $36.61/MWh.
LCOE May Not Tell the Whole Story
Based on the numbers, it would seem wind and solar are the obvious choices for almost any new-build power project. In a statement issued with its April report, BNEF said onshore wind and solar PV “are now the cheapest sources of new-build generation for at least two-thirds of the global population.” It also said “battery storage is now the cheapest new-build technology for peaking purposes (up to two-hours of discharge duration) in gas-importing regions, like Europe, China or Japan.”
However, the EIA noted in its paper, “LCOE does not capture all of the factors that contribute to actual investment decisions, making the direct comparison of LCOE across technologies problematic and misleading as a method to assess the economic competitiveness of various generation alternatives.” It suggested the levelized avoided cost of electricity (LACE) must also be considered.
LACE represents a power plant’s value to the grid. “A generator’s avoided cost reflects the costs that would be incurred to provide the electricity displaced by a new generation project as an estimate of the revenue available to the plant,” the EIA explained. Like LCOE, LACE revenues are converted to a level stream of payments over a plant’s assumed financial lifetime.
The EIA said a power plant is considered economically attractive when its projected LACE (value) exceeds its projected LCOE (cost). These values vary across the country and around the world, as resource availability, fuel costs, and other factors differ by market. LCOE and LACE values also change over time as technology improves, tax credits and subsidies come and go, and fuel costs fluctuate.
As everyone in the power industry knows, some plants can be dispatched, while others, such as wind or solar farms, operate only when the given resources are available. Thus, certain plants can provide electricity during parts of the day or year when power prices are higher, while others may produce electricity during times of relatively low prices. Therefore, the EIA advised that the relative difference between LCOE and LACE is a better indicator of economic competitiveness than either metric alone.
Declining Costs Could Open the Gap
In other words, deciding what type of new generation to add to different parts of the grid is a complicated process. Still, as costs continue to decrease for wind, solar, and battery storage technologies, the difference between LCOE and LACE will likely shrink and eventually favor renewable energy resources in more and more situations.
Tifenn Brandily, lead author of the BNEF report, said, “On current trends, the LCOE of best-in-class solar and wind projects will be pushing below 20 dollars per megawatt-hour this side of 2030.” Those are LCOE’s that are going to be hard to beat. ■
—Aaron Larson is POWER’s executive editor.