3D Visualization Could Benefit Plant Inspection Programs
Taking a cue from the petrochemical sector, power plants may be on the cusp of applying high-fidelity 3D models of the as-built plant environment to streamline flow-accelerated corrosion (FAC) and other risk-based inspection programs. In time, this technology could anchor all of a plant’s digital data.
Advanced industrial and process facilities are now employing 3D visualization software to streamline all aspects of plant operations and maintenance. In concept, the technology is simple. Laser scans of the actual plant equipment are converted into high-fidelity computer graphics for use on engineering and operator workstations.
All of the data, diagrams, documentation, and knowledge about any component stored in other digital or electronic databases can then be anchored to that component (Figure 1) in the context of the actual plant in its current state and condition. “Asset virtualization” is the term used in other industries to describe this process.
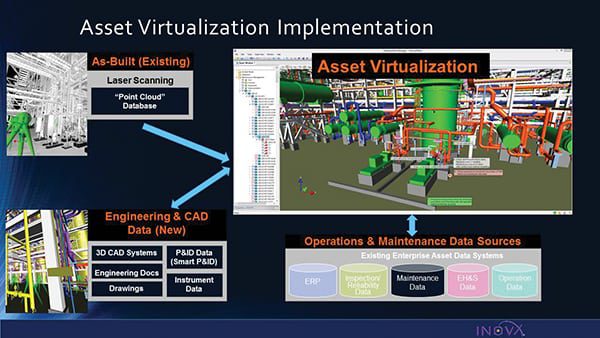 |
| 1. Integration. Converting laser scans into intelligent 3D models integrates as-built plant environment with the digital enterprise. Courtesy: INOVx |
Petrochemical facilities in the U.S. and around the world are applying 3D visualization software solutions for critical piping and vessel inspection programs (see sidebar). In the power sector, many nuclear power plants are early adopters of this technology for maneuvering complex components during outages. Next step for these plants is to move from off-line to online applications in the operating environment.
| 3D Visualization’s Value at a RefineryThe National Cooperative Refinery Association (NCRA) in McPherson, Kan., streamlined its risk-based inspection programs for its 85,000-barrel/day processing facility in 2008. The deployment began with a pilot project involving 19 pumps, 14 heat exchangers, a fractionator tower, and associated piping and structural components at a crude processing unit. Today more than 50% of the facility has been converted to 3D virtualized models, with conversion of all major processing units expected by about 2015.
In the recent past, process and instrument diagrams (P&IDs) were developed as the most accurate representation of the facility’s process equipment. Inspection engineers had to develop indices to match legacy documents to the newly developed P&ID line numbers. Legacy drawings for equipment were often inadequate for current inspection practices, so a draftsperson would then sketch the line in the as-built condition, refine it in the AutoCad System, and then produce an isometric for the inspectors. Today, the 3D models are used to generate drawings of piping “circuits” for inspection teams. The team receives a booklet with essentially everything they need to do the job, including the location, piping, test routines, thickness monitoring locations, corrosion-monitoring locations, and testing procedures. Thickness data are collected in a data logger, downloaded into the plant condition-monitoring system, and automatically associated with the 3D representation of the circuit. NCRA is now integrating the 3D visualization system with the computerized maintenance management system, the distributed control system, and the turnaround (outage) planning processes and procedures. In the near future, inspectors will be able to view the circuits on an iPad or equivalent mobile device which, when integrated with the data loggers, achieves full electronic transfer of information. NCRA’s program resulted in the following benefits, with obvious cost paybacks:
|
Discussions with numerous power plant managers, directors, and executives have made it clear that existing inspection programs are based on antiquated techniques, such as:
- Old process and instrument diagrams, 2D isometrics (in some cases hand-drawn), or scanned versions of old diagrams.
- Lack of proper management of change procedures.
- Reliance on recall of plant personnel in determining what has changed since the last inspections.
- Virtually no “system” context for higher understanding of corrosion phenomena.
- Excel spreadsheets of inspection data that are not linked to drawings.
- Time-, or location-based inspection intervals, rather than inspections based on actual condition.
- Silos of information and knowledge among different stakeholders involved in the inspection routines.
Unfortunately, the situation promises to get worse. The threat of FAC increases with age. Most U.S. nuclear plants and large, flagship coal-fired plants have been operating for several decades. Power uprates, common at most nuclear units, also raise the threat of FAC incidences. As the frequency of inspection grows with aging (but more productive) plants, power plant owners and operators must consider new ways to hold down costs. Petrochemical facilities implementing this technology have enjoyed paybacks of four months to just over a year.
Applying 3D visualization at nuclear plants can reduce the amount of time workers are exposed to radiation, an important key performance indicator, and helps meet several criteria set forth by the Electric Power Research Institute (EPRI) in its 2008 FAC Program Recommendations Document:
- Makes it easier to train back-up personnel and maintain continuity of trained staff.
- Formalizes the sharing of data and information on FAC and a consistent picture of reality.
- Ensures a high level of quality assurance in documenting procedures and preparing tasks.
EPRI and others have documented that FAC has occurred in about 60% of all conventional fossil plants. Increased and deeper load cycling, common at fossil thermal and combined cycle plants, also aggravate FAC. In gas-fired combined cycle and cogeneration plants, FAC is reportedly the leading cause of damage and failure in heat recovery steam generators (see, for example, “Ten Years of Experience with FAC in HRSGs” in the September 2010 issue, online at powermag.com).
According to a paper presented at the Fossil FAC International Conference 2010, one Midwestern owner/operator noted that a formal FAC inspection program started in 2006 has been very successful in identifying thinned components and for justifying their removal from service prior to failure. However, some of their lessons learned are opportunities to improve, using 3D visualization.
For example, care must be exercised in applying assumptions for calculating wastage rates. FAC inspection data taken in 2007 at the previously mentioned Midwestern plant were the first such data obtained since a particular unit went into service in 1972. The wastage rate was calculated assuming 35 years of service, and extrapolation showed it had sufficient remaining life to make it to the 2010 planned outage. It was only after a second failure was experienced with a component that staff realized new control valves had been installed in 1998. The original gate valves had been replaced with trim stacked drag valves, which were subsequently deemed to have adversely affected flow patterns in the pipe. This oversight could have been avoided by having accurate 3D intelligent models of the actual plant equipment.
Reducers and expanders account for most of the replaced components. There are several different configurations of reducers, however, which make data interpretation and damage prediction difficult. The transition zone can be a straight taper, curved taper, stepped taper, or a bulged taper, and the exact point of the thickness transition varies. It is imperative that costly repair/replace decisions based on inspection data be associated to the best extent possible with components in their current state and condition.
To simply illustrate the value of 3D visualization, consider the case of two water sources merged into a common line. Process data are included as text. Piping is initially color-coded according to nominal stream temperatures. Reference data can be readily available through hyperlinks.
FAC susceptibility values can be accessed to graphically enhance areas of interest. In Figure 2, the reflected-light temperature colors are mostly subdued and a red glow is emitted by areas of potentially high damage rates. The application of both reflective and emissive color spectra to the geometrically accurate representation of field piping allows complex theoretical data to be visualized more easily than through thousands of words of text or tabulated data.
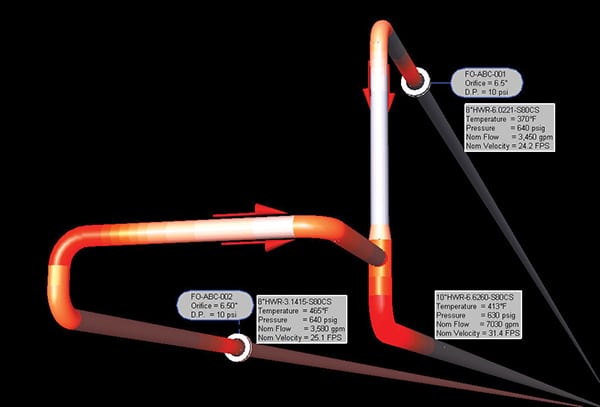 |
| 2. Color coding. Piping can be color-coded to reflect areas of high, medium, or low flow accelerated corrosion susceptibility, allowing personnel to easily understand the system as a whole while process data can be included as text. In this example, reflected-light temperature colors are mostly subdued and a red glow is emitted by areas of potentially high damage rates. Courtesy: INOVx |
A manager of a utility fleet inspection program noted that “having 3D models of the existing equipment to manage diagrams would be huge,” for example, knowing if a section of replaced pipe is 1 foot or 3 feet. Relying on the recall of site personnel or plant documentation is often inadequate. The fact that 3D visualization technology distinguishes insulation from piping is also deemed important, and that each reducer or expander, each fitting, is a distinct entity and can serve as an access point for associated data.
An engineering services manager for a large nuclear fleet stated that the highest value point is linking the 3D models to the computerized maintenance management system’s work order system. Similarly, providing pre-job training and practice briefs would be helpful.
The manager further noted that nuclear units are very old, and were designed on drafting tables. No 3D models exist for most of the plant, and piping inspections are carried out with 2D isometrics. Some drawings have been scanned into AutoCad, but they are not intelligent. Specific and persistent FAC issues with feedwater heaters could really benefit from 3D visualization because the shells have to be regularly checked and the heater bays are crowded with “lots of stuff.” In addition, many areas of piping susceptible to FAC are not accessible.
An asset director for multiple gas turbine cogeneration plants reported, “We have been chasing FAC for 20 years.” This technology could help convert hand-drawn isometrics to models of the actual equipment and enable the shift from time/location-based inspection strategies to condition-based inspection. ■
—Costantino Lanza is with INOVx Solutions, and Jason Makansi is president, Pearl Street Inc.