POWER‘s monthly infographic sheds light on power sector trends globally, and in 2016, it highlighted water issues, future coal fleet technologies, U.S. power plant retirements, energy storage technologies, China’s power glut, global emissions limits, and more.
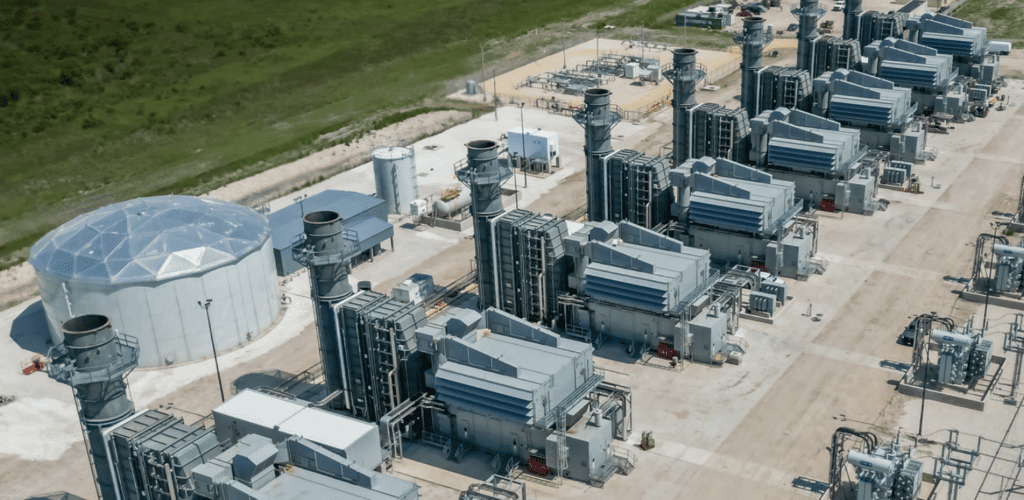
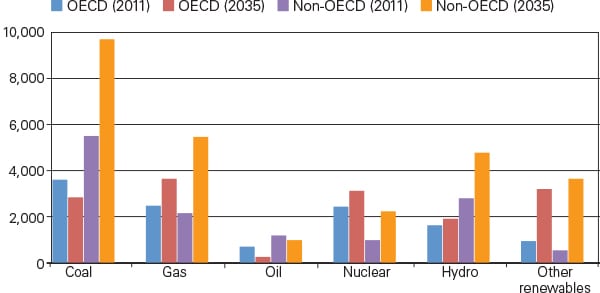
January 2016: Future Coal Fleet
What the world’s future coal fleet will look like by technology.
February 2016: GHG Reduction Pledges
What the world’s top 10 greenhouse gas emitters pledged ahead of the climate summit in Paris.
March 2016: Drops in Water for Power
How climate change and resulting changes in water resources could affect the usable capacity of thermal and hydroelectric plants around the world.
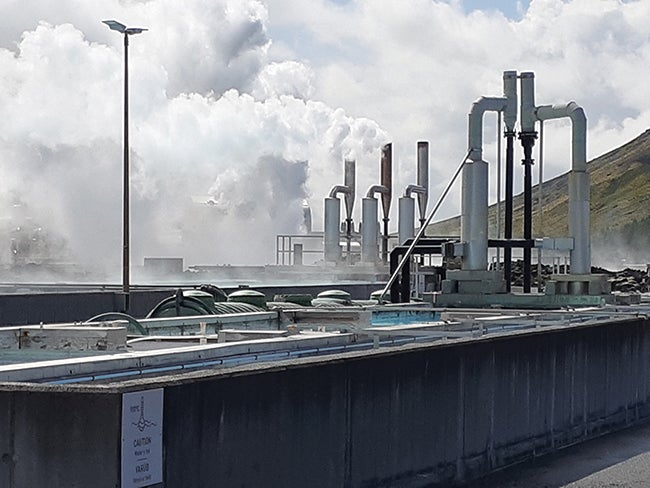
April 2016: Energy for Power
How much energy is consumed to produce power in the U.S.
May 2016: Leading the Charge
How states with more than 10 MW of energy storage compare by technology.
June 2016: A String of Retirements
How power plant retirements have varied wildly over the past decade by fuel and capacity.
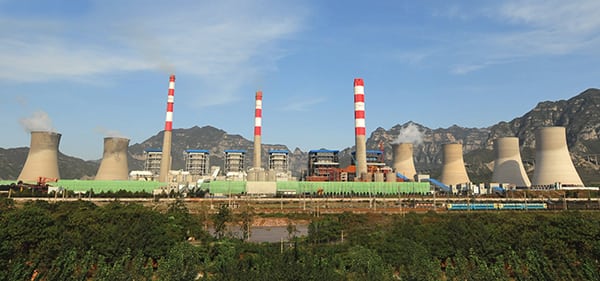
July 2016: China’s Power Glut
How China’s thermal plant utilization rate has changed over the past four years.
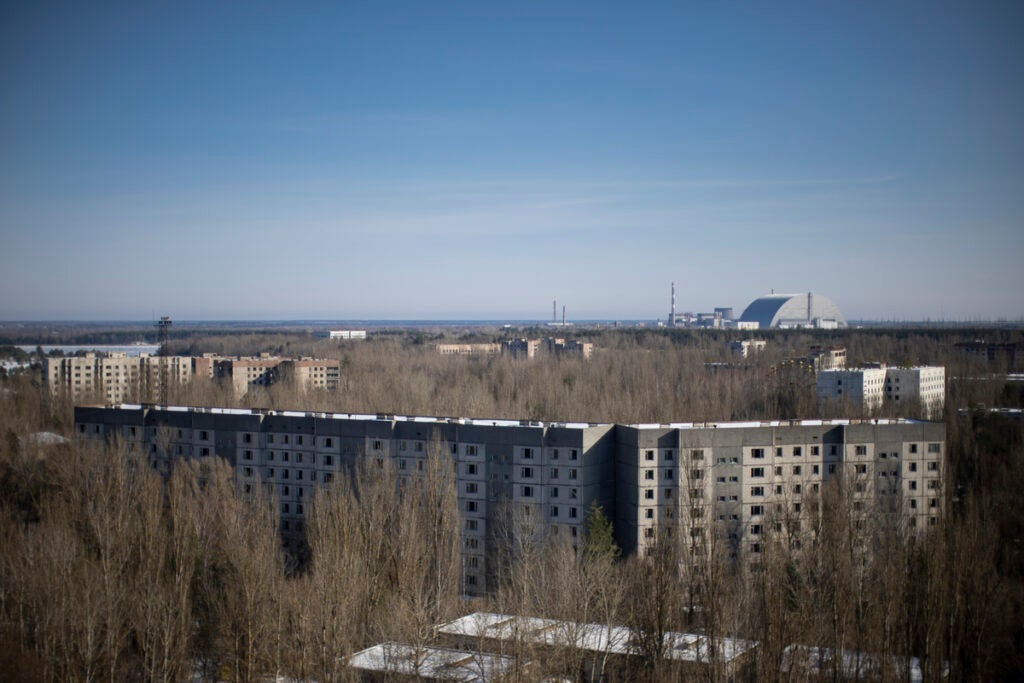
August 2016: Nuclear Retirements
A timeline and map of nuclear plant retirements in the U.S.
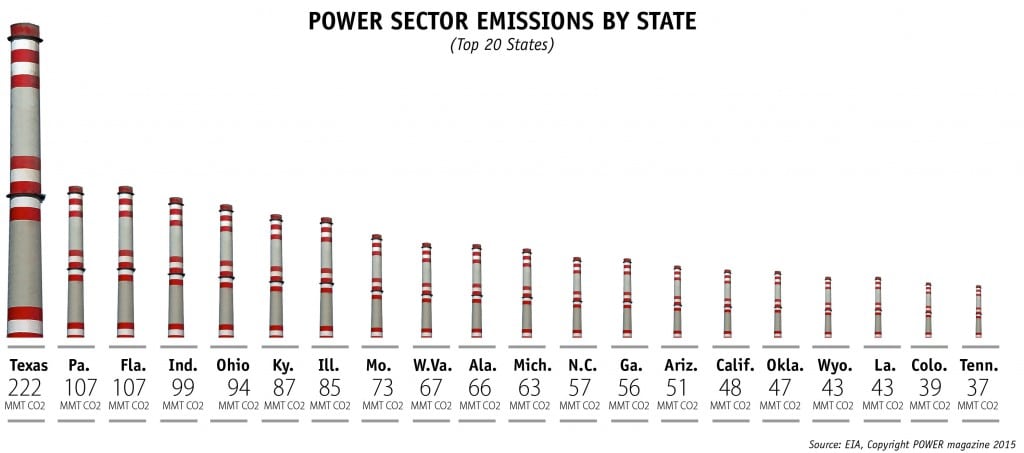
September 2016: Global Emissions Limits
How global emissions limits vary by country.
October 2016: Still in the Dark
Which countries around the world have the largest populations without access to electricity.
December 2016: Renewable Rankings
Which countries are installing the most renewable capacity.
—Sonal Patel, associate editor (@POWERmagazine, @sonalcpatel)