When you’re managing 400-plus solar sites scattered across multiple states, a single transformer failure can cost thousands of dollars per day in lost revenue. But which transformer? At which of your 400 sites? And, more critically, how do you know it’s the most urgent issue demanding your limited maintenance resources right now?
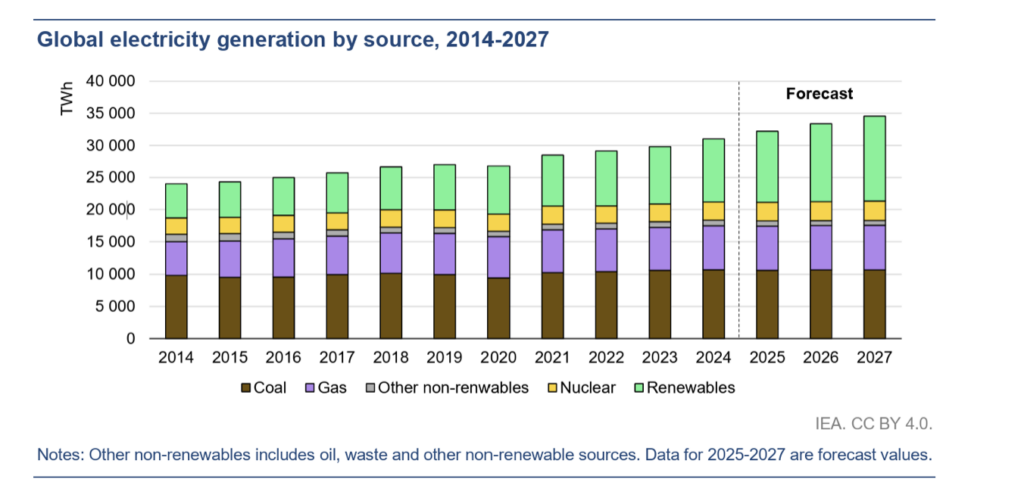
This is the daily reality facing solar operators as the industry experiences extraordinary growth. This summer, global electricity generation from solar farms is projected to surpass nuclear output for the first time ever and exceed 260 TWh in June, July, and August. But this rapid expansion brings complexity. Managing hundreds of sites spread across diverse regions means more data, variability, and opportunity for performance issues to slip through the cracks.
The old way of managing solar portfolios with spreadsheets, disconnected monitoring systems, and reactive maintenance worked fine when you had a dozen sites. But, with continuously growing portfolios, those systems aren’t scalable enough to meet the needs of an expanded solar ecosystem.
Many operators are turning to purpose-built platforms that consolidate data from multiple systems, such as monitoring tools, ticketing platforms, and site-level sensors, into one interface. Instead of chasing down alerts across separate sources, operations and maintenance (O&M) teams can see portfolio performance in a single view, with issues at any site automatically flagged, ranked, and linked to relevant diagnostics.
Before these platforms, tracking down alerts meant sifting through data in different formats and systems. It was an overwhelming task that could take hours or days to figure out when managing hundreds of sites. Without some level of automation, O&M teams would be buried in alerts, making it nearly impossible to properly diagnose issues or prioritize work at scale.
Centralizing data into one platform enables O&M teams to make faster, clearer decisions. Organizations can automatically detect issues and failures, prioritize which plants need immediate attention to mitigate costs or revenue loss, and perform a deeper analysis to identify trends and patterns across their portfolios. These real-time insights are already reshaping how decisions are made, cutting costs, minimizing downtime, and setting the stage for even more growth in the solar industry.
When Every Dollar of Downtime Counts
Managing a solar portfolio at scale is essential to minimizing downtime. According to Siemens, the cost of downtime across all industries doubled from 2019 to 2023, exceeding $800,000 per hour. It also says the average facility had 25 unplanned monthly downtime incidents in 2023, 41% fewer than in 2019. The decrease is due in large part to predictive maintenance, which centralized, purpose-built data platforms can help forecast. Instead of spending valuable time hunting through data acquisition systems and manually pulling monthly reports, asset owners and operators should look to consolidate their data into centralized platforms where they see their entire fleet’s health at a glance and on one dashboard.
 |
|
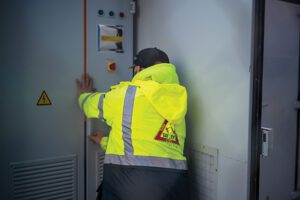
1. A technician works on an IKEA solar power system at a California location. Courtesy: DSD |
Teams can quickly identify which sites are underproducing or where there are unexpected outages, and how those issues affect broader metrics like availability and revenue. If a project site is down and there is zero production at the meter, that is automatically highlighted so teams can immediately see what’s going on and get a jump start on fixing it (Figure 1).
Leveraging smart asset management platforms can also help prioritize what needs to be fixed. Each site can be evaluated using a ranking system incorporating variables like availability, control violations, and production over consecutive days. Teams can review the issue in context, see how long it has persisted, identify if the failure is tied to a part with a long lead time, and track the total cost of delay.
The benefit goes far beyond simple issue identification, with platforms translating the data into real financial impact. If a piece of equipment has failed at a site, teams are able to see exactly how much money that’s costing the company the longer it goes unfixed. With the click of a mouse, you can filter results based on the dollar amount, seeing exactly which problem has the biggest cost influence on your portfolio, and therefore, which fix should be prioritized. These kinds of insights help ensure that the highest-impact issues are never overlooked, even in a portfolio with hundreds of active sites.
Implementing technology like this can also help distinguish between signal and noise to alleviate alert fatigue and flag the most meaningful outages. Instead of blindly dispatching maintenance crews, alerts are reviewed internally to confirm they’re tied to real problems, not just communication gaps or data anomalies. This reduces unnecessary site visits and ensures that technicians are deployed only when and where they’re truly needed, directing limited resources to the highest priority sites.
Using Data to Enhance Customer Trust
Centralized data also improves financial accuracy and strengthens customer relationships. The ability to identify and flag issues that could have financial impacts for both the asset owner and the customer in real time increases transparency and trust.
Without these platforms, it would be difficult to detect mismatches between meter readings and inverter output, but now they stand out right away. That avoids a difficult conversation with a savvy customer who notices a discrepancy between what’s on their bill and what’s coming from the meter. Faulty production meters or inverter communication issues are discovered ahead of time. Instead of fielding questions about discrepancies, teams are proactively notifying customers about adjustments that have already been fixed.
Meanwhile, asset owners can recoup revenue that might otherwise be lost if a site is underreporting due to faulty equipment. When a meter shows artificially low readings while inverters indicate normal production, developers can confidently bill for the actual power generated, not the flawed meter data. It’s easier to spot an imbalance, understand what’s driving the issue, and use other system data to charge for the correct amount of power that’s being produced.
Enhancing Future Decisions with Deeper Analysis
Real-time monitoring is just the beginning. The deeper value of centralized data is its ability to reveal patterns that inform smarter long-term decisions. With complete performance records across hundreds of sites, operators can start asking more sophisticated questions, such as:
■ Are ground-mount systems with trackers performing as expected?
■ Do certain inverters have a higher failure rate?
■ Are certain site configurations vulnerable to seasonal underperformance?
These insights can guide procurement, design adjustments, and even long-term investment strategy. It’s also easier to uncover new variables at specific sites (Figure 2), like weather impacts on a plant’s performance. Analyzing weather-related attributes such as irradiance, soiling, and temperature can reveal how those factors are influencing production levels. Teams can even use data platforms to automatically calculate soiling losses at a site.
 |
|
2. DSD Renewables has provided a 504-kW solar power installation for Delta Electronics in California. Courtesy: DSD |
Even in project development, this kind of analysis has value. Before acquiring a new site or investing in an upgrade, teams can review historical data from similar system types to assess risk and estimate performance more realistically. A centralized platform can also be used to confirm that all major equipment is reporting correctly before a site is turned over from construction to asset management. Similarly, predictive analytics can determine future maintenance on equipment or inform investment decisions. With all of this information in one place, there are endless ways for teams to dig in and analyze what’s happening across their portfolio.
Foundation for Industry Evolution
What started as a way to streamline maintenance and minimize downtime is quickly becoming something more powerful. By implementing integrated platforms that consolidate everything from site-level alerts to long-term performance metrics, O&M teams can now have a clearer view of their portfolios than ever before. That clarity is helping teams respond faster and think bigger.
One of the major benefits of these systems is their ability to scale. The tools enabling this transformation are constantly evolving along with the portfolio. Building these platforms is a continuous, iterative process. Each new issue identified, each pattern discovered, becomes another way to tweak and improve asset management systems. As portfolios become more complex, businesses have a tool that can grow alongside their fleet.
Looking ahead, automation and advanced analytics are likely to play an even larger role. The foundation is already in place to implement AI into these systems and further enhance what analysis it can uncover. Imagine predictive models anticipating equipment failures based on historical performance and site conditions. Instead of waiting for equipment to fail, operators could address potential issues during scheduled maintenance windows, minimizing both downtime and emergency repair costs.
When companies can see clear patterns, they can make smarter decisions about where to spend money and how to fix issues before they become big problems. This shift from reactive to predictive maintenance represents the ultimate evolution of data-driven operations. It doesn’t just stop at maintenance; that future thinking can be applied to all of the data coming out of the system, from forecasting equipment lifespan and anticipating supply chain needs to tracking how sites transition from planning to operation and ultimately scaling future projects. These insights help teams turn raw data into a blueprint for smarter investments and reliable growth.
Data and automation will shape the next phase of solar by enabling more efficient growth, not just efficient operations. As competition intensifies and it gets harder to earn capital investment, treating data as a strategic asset will be essential to maximizing returns and feeling confident navigating the increasing complexity of the solar market.
It isn’t enough to just collect data that you didn’t have previously. Automating insights based on that data is what creates differentiation in performance, efficiency, and value.
—Chris Larkin is vice president of Fleet Operations at DSD.


