Infographics
-
 Legal & Regulatory
DOE Has Issued More Than 40 Section 202(c) Emergency Orders Since May 2025. Here’s an Updated Log.
Since May 2025, the U.S. Department of Energy (DOE) has issued more than 40 emergency orders and extensions under Section 202(c) of the Federal Power Act—more than in any comparable period in the past two decades. The orders have fallen into two broad categories: retirement deferrals, which compel utilities and grid operators to keep specific generating […]
-
 Infographics
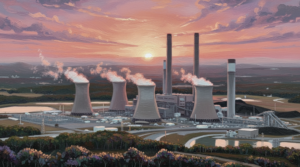
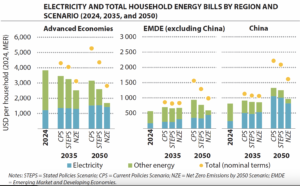
THE BIG PICTURE: Power Affordability [Infographic]
Household electricity use is set to climb sharply through 2035 as electrification expands, shifting power system costs toward capital-intensive grids, renewables, and storage and making affordability increasingly sensitive to policy and financing choices. POWER’s monthly print infographic breaks down the forces reshaping electricity bills worldwide. In its November 2025–released World Energy Outlook, the International Energy […]
-
 Infographics
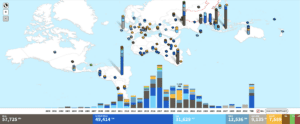
THE BIG PICTURE: Power Built with Chinese Capital
The China Global Power (CGP) Database, developed by Boston University’s Global Development Policy Center, systematically tracks power plants outside of China that are financed through Chinese foreign direct investment and its two major policy banks—the China Development Bank and the Export-Import Bank of China. As of mid-2022, China-backed investments supported 648 power plants across 171.6 […]
-
 News
NewsPOWER Magazine January 2025 Issue Preview
POWER is the one brand that addresses all electric power generation and related technologies and fuels across North America and around the world, providing insight into this increasingly complex industry. Established in 1882, it is dedicated to providing its global audience with exclusive analysis of the latest trends, best practices, and power generation and related […]
-
 Trends
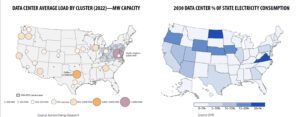
THE BIG PICTURE: How Much Power Will Data Centers Consume? (Infographic)
Driven by artificial intelligence (AI), cloud computing, and the digital transformation, U.S. data centers consumed an estimated 150 TWh of electricity in 2023—equivalent to around 3% of the nation’s power demand. Globally, data center demand hovered at 340 TWh in 2023—about 1.3% of worldwide electricity use. Multiple sources project this demand will surge dramatically through […]
-
 Hydrogen
THE BIG PICTURE: Hydrogen Cofiring at U.S. Gas Power Plants (Infographic)
While natural gas power accounted for 43% of total U.S. power generation in 2023, several state and federal policies aimed at reducing greenhouse gas emissions are bolstering interest in hydrogen cofiring. These policies include the Environmental Protection Agency’s recently finalized Carbon Pollution Standards, federal production tax credits, and the federal hydrogen hub program. However, only […]
-
 Infographics
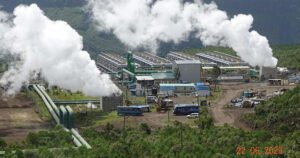
THE BIG PICTURE: Geothermal Power Landscape (Infographic)
According to the Global Geothermal Power Tracker (GGPT), a comprehensive dataset of geothermal power facilities, about 14 GW of geothermal power is operational worldwide. The U.S. has the largest installed capacity at 3,900 MW, followed by Indonesia (2,418 MW), the Philippines (1,952 MW), Türkiye (1,691 MW), New Zealand (1,042 MW), and Kenya (985 MW). Most […]
-
IIOT Power
The Big Picture (Infographic): Power Sector Digitalization Use Cases
In a recent article in the journal Energy, experts from universities in Portugal, Switzerland, the U.S., and Romania identify digitalization as a pivotal phenomenon affecting the electricity sector, alongside other “megatrends” such as decarbonization, decentralization, and deregulation. Despite the increasing focus on the effects of digitalization on power systems, the authors highlight a notable gap: […]
-
 Infographics
The Big Picture: Coal Controls [Infographic]
U.S. coal power plant emissions in 2023 showed dramatic reductions in air pollutants, owing mainly to coal plant closures. According to the U.S. Environmental Protection Agency (EPA), compared to 2022, sulfur dioxide emissions fell by 24%, nitrogen oxides (NOx) by 15%, carbon dioxide by 7%, and mercury by 17%. Over the years, coal plants have […]
-
 Infographics
The Big Picture: A U.S. Hydropower Profile (Infographic)
The U.S. conventional hydropower fleet includes 2,252 hydropower plants with a total generating capacity of 80.58 GW, which produced 6.2% of the country’s electricity in 2022 and nearly 30% of all renewable generation. In addition, it has 43 pumped-storage hydro (PSH) plants, a combined capacity of 22 GW, and an estimated energy storage capacity of 553 […]
-
Infographics
THE BIG PICTURE: U.S. Combined Heat and Power and Microgrids
As of December 2022, the Department of Energy (DOE) CHP Installation Database recorded 4,674 combined heat and power (CHP) installations in the U.S., with a combined capacity of 80.4 GW. Installations were all sizes, from large industrial systems that are hundreds of megawatts to small commercial microturbine and fuel cell systems that are tens of […]
-
 Infographics
The Big Picture: Off-Grid Power [Infographic]
An estimated 91% of the world’s population had access to electricity in 2020, marking substantial progress toward goals to ensure universal access to power. Still, according to the International Renewable Energy Agency (IRENA), 733 million people remain unserved. Off-grid and decentralized energy systems may be emerging as an alternative to facilitate energy access and resilience, […]
-
 Trends
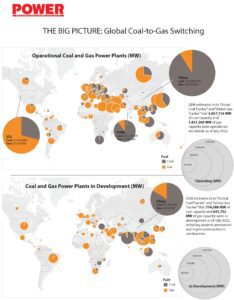
THE BIG PICTURE: Global Coal-to-Gas Switching
The Global Energy Monitor (GEM), an organization dedicated to enhancing understanding of climate change data, in a recent report, estimated that about 89.6 GW (or 13%) of the 692 GW of global gas-fired capacity in development are coal-to-gas conversions or replacements. East Asia has the most coal-to-gas conversions or replacements in development (29.6 GW). By […]
-
 History
The Big Picture: Power Plant Additions Over the Decades [Infographic]
The deployment of new power plants in the U.S. over the past 14 decades has hinged on policies, markets, technologies, and new industry players. Every decade has presented its own state of multidimensional, multivariate complexity. The ongoing “energy transition,” which has been characterized by the addition of smaller, carbon-free resources, marks another pivotal period in […]
-
 Infographics
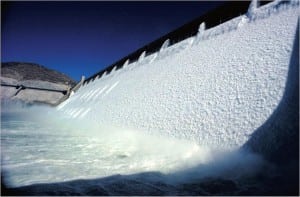
THE BIG PICTURE: Hydropower’s Climate Risks
While hydropower provides about 16% of global electricity generation today, climate change is predicted to drive various changes in hydrology that could translate into a spectrum of risks for hydropower production. A recent study published in the journal Water estimates 61% of all global hydropower dams will be in basins with very high or extreme […]
-
Infographics
THE BIG PICTURE: Momentum for CCS
While only one commercial power plant equipped with carbon capture and storage (CCS) remains in operation today, the momentum for CCS appears to have picked up dramatically over the past year. According to a database curated by the Global CCS Institute, more than 30 power generation CCS projects are under construction or in various stages […]
-
 Infographics
The BIG PICTURE: Battery Storage Expansion
The Energy Information Administration’s (EIA’s) June 2021 electric generator inventory suggests 260 battery energy storage systems (BESSs) are now operational in the U.S., representing a total nameplate capacity of 2,673 MW. Another 12,914 MW from 212 BESS projects are in various stages of planning or construction, with more than 10 GW readying to begin operations […]
-
 Infographics
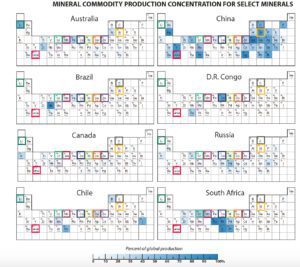
THE BIG PICTURE: Critical Mineral Concerns
The shift to a clean energy system is set to drive a significant increase in requirements for critical minerals. Under an International Energy Agency (IEA) scenario that meets the Paris Agreement goals, clean energy technologies’ share of total critical mineral demand will likely soar over the next two decades to over 40% for copper and […]
-
 Infographics
THE BIG PICTURE (Infographic): Hybrid Power
At the end of 2019, 125 projects larger than 1 MW were co-located with other generators or storage at a single point of interconnection across the U.S., according to a July 2020 report from Lawrence Berkeley National Laboratory. These “hybrid/co-located” projects, which exist in various configurations, represent a combined 13.4 GW of generating capacity and […]
-
Power
THE BIG PICTURE: Pandemic Impact on Demand
The coronavirus pandemic has triggered a macroeconomic shock that is unprecedented in peacetime. By the end of the first quarter, its effects on global power demand were deep, the International Energy Agency (IEA) noted in a flagship report released on April 30. The international organization, which has collected daily data for more than 30 countries […]