Cycling your steam power plant is inevitable, so now is the time to learn how to minimize equipment damage and assess the true costs of cycling. Whether cycling is required by the grid operator because of renewable integration or other factors, you must be proactive about updating operating processes and upgrade equipment so the transition to cycling operation goes smoothly.
Few conventional steam plants were designed to follow load, cycle from minimum to full load every day, or shut down and start up daily, as so many plants are called upon to do these days. The challenge for owners of plants required to operate in this way is to fully understand the effects on plant and component life expectancy, and the actual costs, of these new operating profiles. If the actual costs are unknown, making a profit becomes a matter of luck rather than good management.
In a competitive electricity market, not knowing your true generating costs could place your plant or your company in economic jeopardy. For example, if the actual cost of cycling a unit is not included in your bid price, and the plant must cycle, not only are you not being compensated for unknown damage to plant equipment, but you also are not being compensated for future maintenance and unplanned repair outages. Those costs often far exceed the short-term profits gained by submitting an artificially low market bid price.
Furthermore, the bill for the true cost of operation will arrive after the fact, often years later, in the form of lower capacity factors, less generation, and higher production costs. If, at that time you update production costs to reflect your new reality, your plant may no longer be competitive, resulting in even worse economics.
The same scenario applies in a regulated environment: Future higher-than-expected operating and maintenance costs have to be justified to the public utilities regulators and may not be recoverable.
The following discussion applies equally to solid fuel–fired steam plants and natural gas–fired combined cycle plants.
Cycling for Dollars
Cycling your plant without understanding the costs or applying care and expert guidance when cycling often leads to significant damage, frequent forced outages, and loss of power generation. Bad long-term decisions may be driven by short-term or uninformed decisions, making your plant unreliable during high-profit periods. The fatigue damage added to an older baseload power plant causes creep fatigue interaction damage, rapid increase in boiler tube failures, and many other component failures, including turbine generator and balance-of-plant early creep fatigue failures. In effect, excessive cycling will either decrease the life expectancy of your equipment, or the costs to maintain the equipment will rise, sometimes significantly. Also remember that poorly written startup and shutdown operating instructions or a failure to follow standard processes can often contribute to increased cycling damage and resultant costs.
In our experience, about 60% to 80% of all power plant failures are related to cycling operations. If plant management understands the costs and has a process that provides actual operating costs, it is able to take proactive operational measures rather than deal with unexpected costs and poor performance years after damage to plant systems is done (Figure 1).
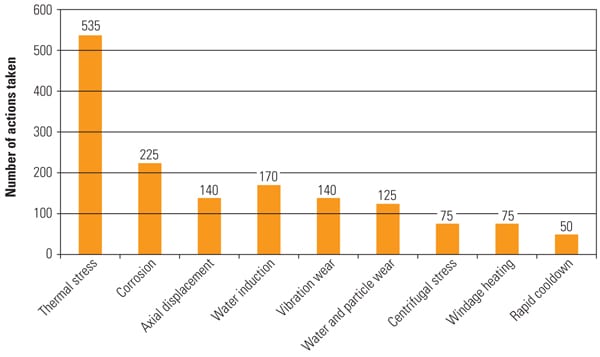 |
| 1. Common problems in cycling plants. A survey of 215 steam plants found many common equipment problems. Source: Intertek-Aptech |
Locating Failures
Failures in coal plant equipment caused by frequent cycling are not isolated events but often occur at unexpected times throughout a plant. Many of the failure modes and locations are not unexpected, but others may be surprising even to an experienced plant operator. Prevention of these failures or managing failure rates is key to success. One approach to reducing cycling damage is to modify the unit’s low-load limit to prevent cycling damage. By reducing the low-load limit on a 750-MW supercritical gas-fired unit from 150 MW to 28 MW at night, it was possible to make the daily cycling load profitable, but it was no small task.
The following subsections are provided to give you a sense of the magnitude of systems and components within a typical coal-fired plant designed for baseload operation that are affected by cycling and load-following service. Although they are not listed separately, controls are also affected; some plants must upgrade old analog controls to digital controls in order to improve response to remotely supplied automatic generation controls before they are capable of cycling.
Steam Turbine Generators. The life of a steam turbine is directly related to thermal transients experienced over time. In fact, the typical steam turbine startup ramp rate is well-defined by the manufacturer, as there are limits to the heating rates of the rotating parts. Steam turbines require slow temperature changes to manage the thermal stress in their heavy metal components (Figure 2).
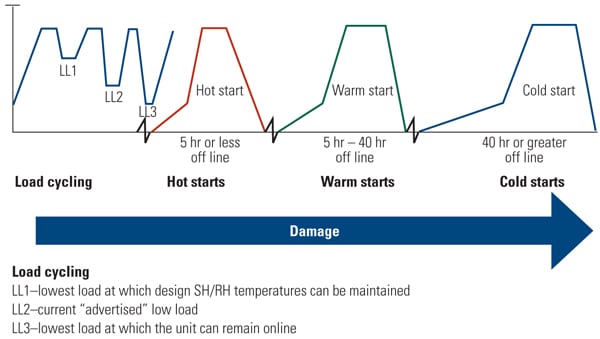 |
| 2. Relative damage caused by cycling steam plants. Courtesy: Intertek-Aptech |
An essential design element of a reliable cycling unit is a steam bypass system. When in operation, high-temperature steam is pressure-reduced and cooled by mixing condensate with the hot steam in a desuperheater and then bypassed around the steam turbine to the condenser. Additional steam bypass to the condenser often requires condenser modifications. In some steam turbine designs, the steam seals may need to be replaced to prevent steam flow from bypassing the rotor stages or sections. Finally, an electric heated turbine blanket system may be beneficial during hot restarts to reduce thermal stress and distortion, ensuring a quicker start.
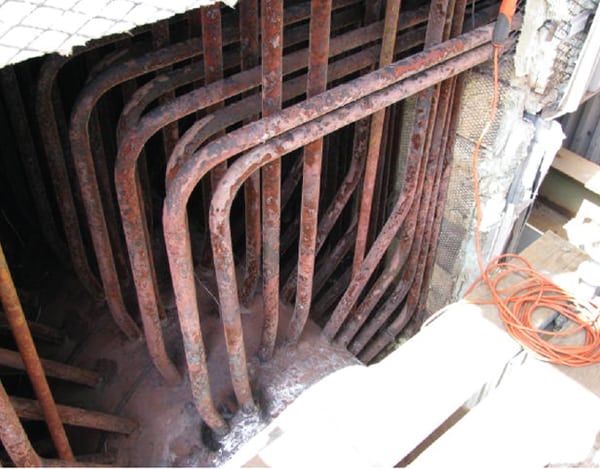
Boiler. In the superheater section, damage to tubing is usually caused by overheating that results from low or no flow of cooling steam through the tubes during startup and/or poor combustion gas temperature management. Damage to superheater tubing is usually evident by severe bowing and thermal distortion due to overheating damage of tubes fully exposed in the gas path. Also, superheater tube damage can result from condensate, and stagnate or reverse steam flows during startup. Similar overheating damage often occurs in reheater tubing (Figures 3 and 4).
 |
| 3. Tube bending. Thermal forces bowed and permanently bent this boiler superheater tubing, including the water-cooled support tube and clips. Courtesy: Intertek-Aptech |
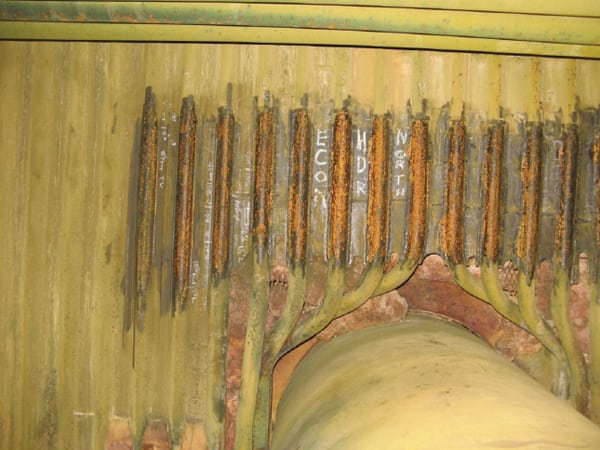 |
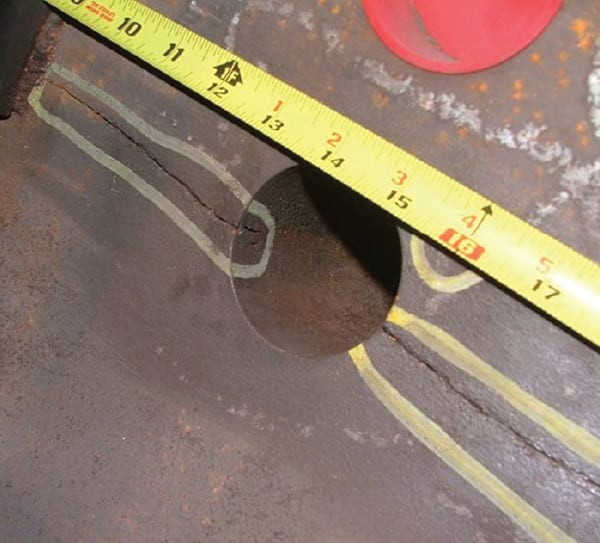
| 4. Breaking bad. Corrosion fatigue damage in the steam-cooled wall in the heat recovery area is evident in this photo. The steam-cooled sidewall has a damaged economizer header penetration. Cycling caused differential thermal growth, and the penetration is badly damaged. Note the numerous repair welds and the broken and missing refractory caused by thermal growth. Courtesy: Intertek-Aptech |
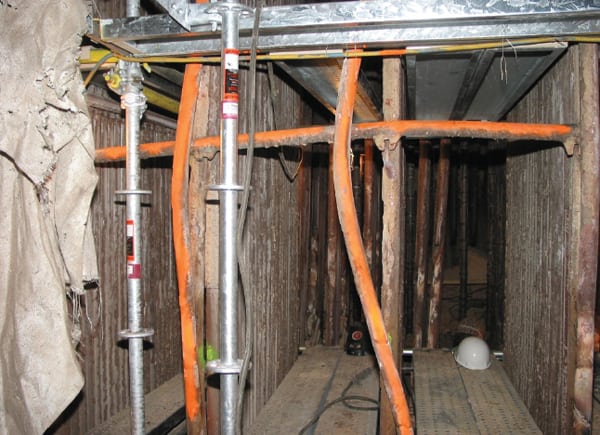
The effects of cycling the steam generator usually materialize as stress cracking in the waterwall tubing at attachments like the windbox, corner tubes, and wall box openings. Stress cracking in the waterwall tubing at the buckstay attachments is usually caused by nonuniform thermal movement of the boiler and its support system (Figures 5 and 6).
 |
| 5. Wobbly walls. Outside the boiler we see the thermal damage in supports. The photo shows thermal damage on the boiler support structure, specifically the sidewall buckstay at the windbox attachment. Courtesy: Intertek-Aptech |
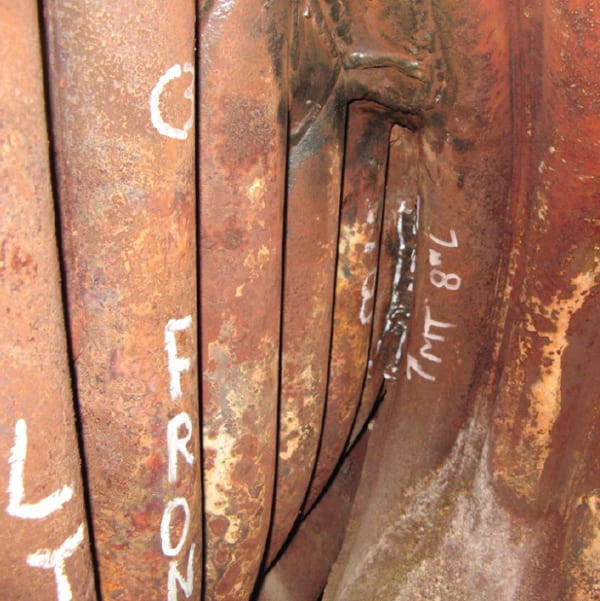 |
| 6. Bending corners. Boilers are typically rectangular boxes rather than round or spherical. This photo shows waterwall corrosion fatigue damage at the lower furnace seal and attachment of the front wall vee bottom to the sidewall, showing weld repairs. It is an example of cycling damage at a corner or a change in shape. Courtesy: Intertek-Aptech |
Although temperature levels are much lower in the economizer, thermal damage can still occur there. Economizer tube failures are usually caused by thermal shocking of the inlet header and tubing with relatively cold water, often during startup. Corrosion may also occur in areas of the economizer where cold water reduces the metal temperature (structure or tubing) below the acid dew point of the stack gas during low-load operation. When the stack gas is reduced below the acid dew point, the minute portions of sulfur that remain in the gas can combine with the condensed moisture and form dilute solutions of very corrosive sulfuric acid on tubes and structures.
In addition to boiler design- and operation-caused tube failures, poor boiler water chemistry control can be a contributing cause. In some plants, the entire water chemistry program must be reformulated to optimize remaining boiler tube life.
Often, the key to reducing waterwall tube wastage is simply using a nitrogen blanket over the internal tube wetted surfaces when the boiler is removed from service or draining it. Also consider a nitrogen blanket in the condensate storage tank to minimize the oxygen content in the condensate during starts.
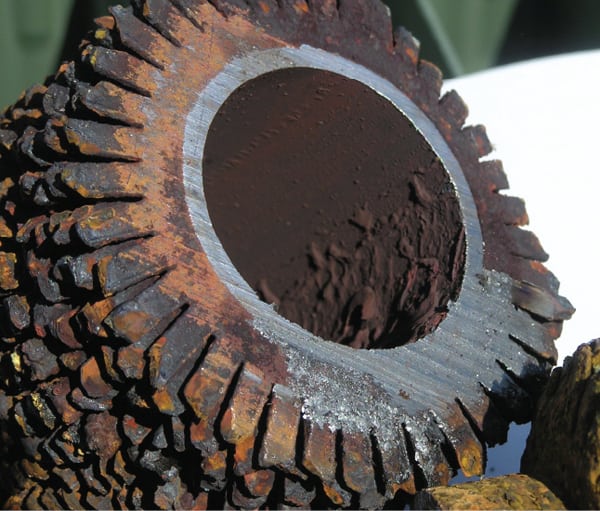
In heat recovery steam generators (HRSGs), the typical cycling problems can be traced back to superheater and reheater drains that fail to clear accumulated condensate. Flow-accelerated corrosion (FAC) in the low-pressure evaporator and failure of feedwater heaters from thermal shock and FAC also are often found (Figures 7 and 8).
 |
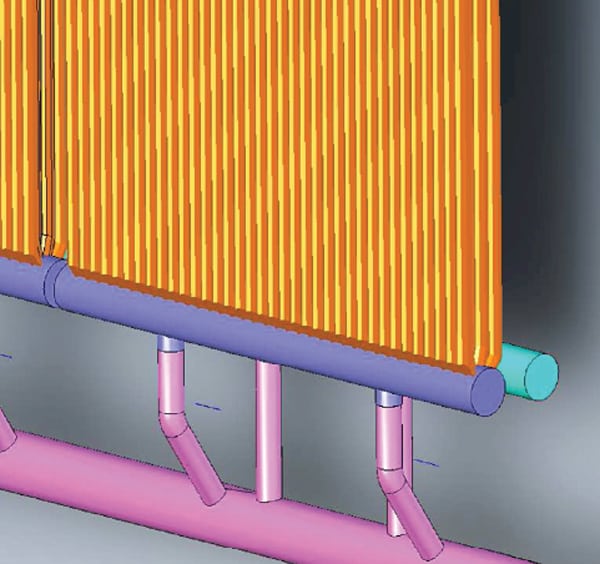
| 7. Inflexible headers. Reheater outlet header and tube-to-header weld fatigue damage at the end of the header is shown. The high-stress location is the short run of tubing where the tube cracked, due to low tube flexibility. The stress is a result of thermal loading and deflection during startup cycles. Courtesy: Intertek-Aptech |
 |
| 8. Leaky heaters. This HRSG feedwater heater tube was one of many failures that resulted from cold-end corrosion during cycling. There were numerous leaks at the tube-to-header connection caused by thermal cycling damage. Courtesy: Intertek-Aptech |
Fuel Systems. Coal pulverizers are prone to fireside explosions, especially when using western coals. They require careful fuel purging and the addition of an inert gas blanket (inerting) when they are cycled off-line. Also, pulverizers are prone to much increased mechanical wear when they are cycled or operated at the low end of their design minimum flow rates. (For more information on proper operating and maintenance of coal pulverizers, see “ ‘Blueprint’ Your Pulverizer for Improved Performance,” March 2009 and “To Optimize Performance, Begin at the Pulverizers,” February 2007 in the POWER archives at https://www.powermag.com.)
Another unanticipated consequence of cycling a solid-fuel plant is the additional maintenance required on the coal silos. When burn rates are difficult to predict, the holding time of western coals in silos can extend beyond six or seven days, the maximum time considered safe. Longer storage of western coals often causes an increase in the frequency of hot spots and fires inside the coal silos. The same safety issues apply to coal pile management and inventory control, as burn rates constantly change due to plant load cycling or low-load following.
Air and Gas Systems. The forced and induced draft fans on coal-fired units can range from a few hundred to well over a thousand horsepower. Frequent starting and stopping of the fans—and, just as importantly, the motors that drive the fans—will increase failure rates, inspection intervals, and motor-fan maintenance. In some cases, fans have required retrofit of new drive systems for soft or low-stress starting. Additionally, air heaters and baghouses are subject to wet gas corrosion, plugging, and damage caused by operating below the wet gas dew point during low-load operations.
Water Systems. It may seem counterintuitive, but makeup water consumption greatly increases for a cycling unit because of the large amounts of water used during startup. In fact, it’s possible that the plant’s demineralized water supply and water storage may need to increase to support the increased boiler water usage.
The entire feedwater system is affected by thermally cycling plants. For example, feedwater heaters are subject to cooldown and rapid heating during a hot or warm startup cycle, and this often leads to early tube failures. Boiler feed pumps are normally designed for full-load operation and experience accelerated wear when operated at low loads. Also, boiler feed pumps may be required to stop and start several times for one startup cycle, thus causing many feedwater transients. In some plants, a smaller, low-load feedwater pump may be necessary for a cycling unit to limit damage to the main feedwater pumps. In others, boiler feedwater and condensate pumps may require added recirculation capability, and the economizer may require recirculation to keep exit water temperatures in check.
Combustion Turbines. Gas-fired combined cycles may be quick-acting in comparison with a coal-fired plant, but they are not immune to the same thermal stress–related equipment damage described above. Based on our experience with combined cycle plants, we have found that the largest line item on a plant’s operating and maintenance budget is costs related to cycling.
One reason cycling costs are proportionally higher in combined cycles is that turbine inspection and repair intervals are transitioned to being principally based on numbers of starts rather than operating hours. Therefore, the cost to maintain combined cycle availability is high on a per-unit-of-electricity-produced basis. The cost of replacement parts found damaged during overhauls, or “parts fallout” due to cycling, is often a factor of two or more over the plant life compared with baseload operation.
Asset Management Principles
Managing power plants to operate at low cost and without excessive damage is the goal of every plant owner (see sidebar, p. 66). The cost of baseload operation is, for example, two-dimensional—the costs are based on operating hours at full load. However, cycling a unit poses a multi-dimensional problem that is difficult to comprehend or cost estimate. The challenge expands progressively because “cycling operation” is a broad concept that encompasses load-following, low load, hot starts, warm starts, and cold start of a plant with different lengths of time between operations; it is definitely not solely time-based.
Following are some useful suggestions for how to begin defining the true cost of cycling your plant. First, examine all the operating and maintenance cost categories that apply beyond fuel. We discussed a number of examples earlier. Equipment suppliers often provide life-reduction curves based on the time or number of instances that a steam turbine, for example, exceeds temperature and pressure design and ramp rate limits when started or load cycled. Other areas in your cycling operation cost accounting include:
- Increased equipment maintenance costs.
- Increased forced outages costs.
- Heat rate losses during startup through synchronization and loading to zero load.
- Heat rate losses during operation at loads lower than full load, including increased auxiliary power usage.
- Heat rate losses due to cycling, such as leaky seals and valves, and worn out or less-efficient heat transfer equipment during cycling.
- Additional startup fuel, chemicals, and staff required.
- Long-term loss of critical equipment life, such as the boiler/HRSG components (superheaters, reheaters, economizers, feedwater heaters, condenser, and other balance-of-plant equipment).
When these costs, defined for a range of operating scenarios, are determined, then you are ready to begin to prepare a pragmatic accounting of costs to meet a particular dispatch order or operating/shutdown order priority goal.
The financial model will also answer the question we are asked most frequently: Is it more financially prudent to shut down a particular unit at night to save fuel and incur the multitude of cycling costs or stay online at minimum load and burn fuel? The answer to that question is obviously unit/system-specific, but there are some trends based on client experience after the true cost of cycling has been determined. Many of our clients have reduced unit minimum loads to 5% to 20% of rated load on fossil boilers so that units can “simmer” overnight. This approach keeps the equipment hot and ready to quickly ramp up to full load (a big advantage in a competitive market), yet it uses minimum fuel at night.
The Costs of Cycling Are Considerable
Now that the types of equipment affected by cycling have been generally defined and the need for a detailed financial model determined, let’s examine more explicit data on the costs of cycling.
Our data generally indicate that cold starts are the most damaging, followed by warm starts and then hot starts, as illustrated in Figure 2. However, although load-following is much less damaging than hot starts, load-following can be very damaging when moving to lower loads that have lower temperatures and, thus, greater temperature changes. It is very important to recognize, count, and classify all these minor load-following operations and ensure that the sum of the load-following periods is properly accounted for in the cycling damage and the financial model.
Former baseloaded units that have been pressed into heavy load-following service often incur millions of dollars of additional damage as a result of operating mode changes. Intertek-Aptech has prepared a number of financial models to document the true cost of such cycling. In one case the model was used as part of a successful public utility commission case filing for a cost of operations recovery claim. Table 1 illustrates the general range of cycling costs included in that specific claim and contrasts common rules of thumb with hard data. Table 2 summarizes the estimated cycling costs for a 500-MW conventional coal-fired plant developed as part of a recently completed cycling study. The estimates developed using the approach described in the following sections were several times larger than customers’ estimates.
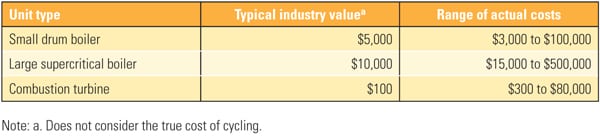 |
| Table 1. Cost to cycle a unit, per operation. The true cost of cycling a unit is often much larger than the estimates used by many plant operators. Source: Intertek-Aptech |
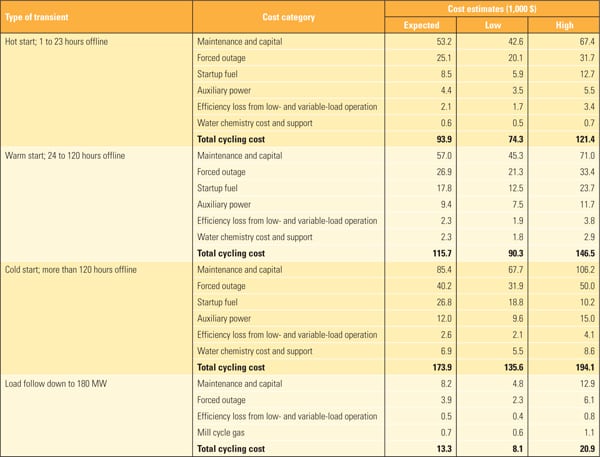 |
| Table 2. Typical cycling costs for a 500-MW coal-fired power plant. Costs are shown in 2008 dollars. Source: Intertek-Aptech |
Cost-of-Cycling Estimates
The Intertek-Aptech staff has developed two approaches to developing cycling cost estimates, such as the one summarized in Table 2, so that results can be compared and validated: the top-down estimate and the bottom-up estimate. Unit- and plant-specific information and industry data on similar units are also used in these analyses.
Top-Down Estimates. Top-down estimates use historical unit operating data and historical cost data to determine the costs of cycling operations (hot, warm, and cold starts and shutdowns; load following; and ancillary services such as regulation and ramping). Fundamentally, we take wear and tear costs and other cycling-related costs and statistically determine the costs of cycling using detailed multivariable regression techniques that examine cost versus total cycling damage.
The first step to determining operating costs is to examine the actual validated plant maintenance costs, primarily found in work orders. The costs we take into account include the operating, maintenance, and capitalized maintenance costs incurred by the unit, while those unrelated to equipment maintenance are eliminated. Other cycling-related costs—such as the cost of fuel and chemicals for water treatment used for startups, and costs related to the increased outages caused by cycling—are also accounted for. These costs are then analyzed, processed, and tallied to create annual “candidate” cycling costs for the unit. All of these costs are candidates for our analyses, which determine the relationship between costs and the unit’s total cycling operational damage.
The second step is to add cycling damage to the maintenance cost estimates. The damage the unit accumulates from cycling is determined by examining the plant’s operating records. Specifically, the hourly average power output of the unit’s generator is analyzed to count cycles (all types of cycling and load-following) and determine the historical damage that the unit has accumulated versus baseload operation. We calibrate the damage during load transients and starts to plant signature data obtained during typical transients and starts.
Finally, we take the accumulated damage and historical costs to calculate a statistical “best estimate” of the cycling costs and calculate the upper and lower bounds using statistical regression techniques. In sum, we develop probabilistic estimates of the effects of cold, warm, and hot starts; shutdowns; and load-following operating modes.
We prove these estimates are valid by backcasting historical costs as a function of cycling costs. We know past costs are the best predictors of future costs when unit cycling remains constant. However, a significant increase in cycling and ramp rates can significantly accelerate equipment damage and increase future costs.
Bottom-Up Estimates. The other cost-estimating process is the bottom-up analysis. It is referred to as a bottom-up because it starts with the detailed work order history and a review of failure events and analysis completed earlier. The bottom-up review includes seven to 10 years’ worth of plant work orders, when available. The review includes a detailed analysis of work orders by a subject matter expert (SME), often including the plant personnel, to classify the costs as either related to cycling or to normal plant (baseload operation) costs. Actual failure reports, overhaul records, and prior inspection reports are also checked to determine the root cause of previous failures so that the costs can be properly classified.
This analysis uses actual plant signature data from representative starts and shutdowns and gives consideration to known design and operations issues. Load-following and actual plant ramp rates are examined, including the absolute temperature change from carefully selected data points to validate the type of damages.
Comparing Cost Estimates
The result of these cost analysis approaches are cost estimates for various plant systems and sub-systems that identify the actual (usually the minimum) cost of cycling (based on recent historical costs). Those estimates can be used to predict future cycling costs. These cost estimates may be adjusted by latent damages factors determined by the SMEs, based on failure rates, inspections, interviews, or signature data. The estimates identify high-risk failures without detailed condition assessment inspections of many components. The estimates may drive limited specific condition-based inspections to validate the risk of failure or time for replacement. The estimates also include specific countermeasures with a valid cost-benefit at several levels with a return on investment for budget planning.
When the two cost estimates are completed, the customer has a report of detailed operating costs with recommended design improvements, equipment upgrades/replacement, and operating process improvements. The plant owner has hard data that specifies the costs of cycling the plant and a plan for managing cycling costs in the future with hardware and operating plant improvements. These plant improvement costs are usually ranked by cost-benefit and implementation costs. Some operating process or procedure improvements can be realized at little or no cost. Usually, those plant modifications with the highest benefit-cost ratio are quickly put into the company’s capital planning cycle.
The electricity market has appreciably changed over the past decade, especially with the introduction of large amounts of nondispatchable wind and solar power in some regional markets. Cycling a plant is not necessarily a bad practice. But the decision to do so should be made by an owner who has full knowledge of all the available options and estimates of the real costs that must be paid, today or in the future, as a result of that decision. Give plants the tools they need to manage cycling costs, and they will produce winning results.
— Steven A. Lefton (steve.lefton@intertek.com) is director, power plant projects and Douglas Hilleman, PE (douglas.hilleman@intertek.com) is senior project manager for Intertek-Aptech.