The EUCG Nuclear Committee has collected benchmarking data of U.S. nuclear plant staffing for many years. A summary of this highly desirable data was gleaned from EUCG databases and is now, for the first time, made public through an exclusive agreement with POWER.
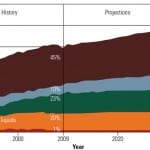
Electricity consumption in the U.S. has decreased during each of the past two years — the first time that has happened since 1973 – 1975, according to U.S. Energy Information Administration (EIA) data. Historically, electricity consumption has correlated well with the nation’s gross domestic product (GDP), although electricity used per unit of GDP has been halved since 1970. Surprisingly, this trend seems to explode the long-held tenet that there is a strong statistical link between GDP growth and electricity consumption. The statistical correlation may have weakened, but a certain and economic source of electricity is undoubtedly an essential ingredient for future economic recovery (Table 1).
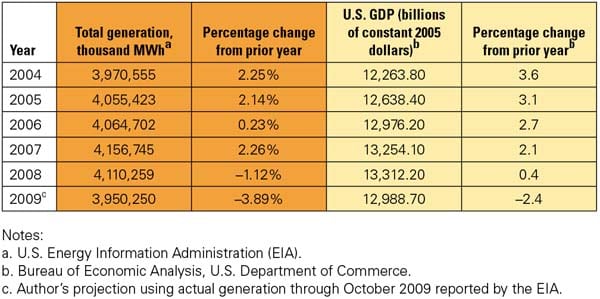
Table 1. Electricity use closely tracks GDP, although more loosely than in the past. Sources: U.S. Energy Information Administration and the Bureau of Economic Analysis
The relationship between today’s economic doldrums and electricity consumption patterns remains unclear to analysts planning for future plants. Do the electricity generation data merely reflect this country’s recent reduced industrial production, or do they reflect accelerated adoption of energy efficiency measures, and if so, how much? Have electricity prices, rising more rapidly than wages, forced short-lived conservation on some classes of electricity users? Has the recession inequitably affected electricity-intensive industries, such as concrete and aluminum (down about 17% in 2009 alone), to skew the electricity consumption data? Has outsourcing manufacturing overseas permanently reduced demand in some regions of the U.S.? Resumption of electricity consumption growth will be an early indicator of renewed economic growth, regardless of how elastic the relationship might be.
Give Proper Credit
Reduced electricity usage over the past two years has had an interesting impact on the mix of generation resources. Offsetting a reduction of 7.6% in coal-fired generation during the 12 months prior to October 2009 was an increase in hydroelectric generation over the same period caused by well-above-average rainfall. Low natural gas prices also added operating hours to combined-cycle plants that have seen limited service during the past few years. Both hydroelectric and gas-fired plants cut into coal-fired generation in 2009, as did off-peak wind generation in some regions of the U.S. In the midst of this uncertainty, nuclear power steadfastly remained the industry’s lowest-price generator and most reliable source of baseload electricity (Table 2).
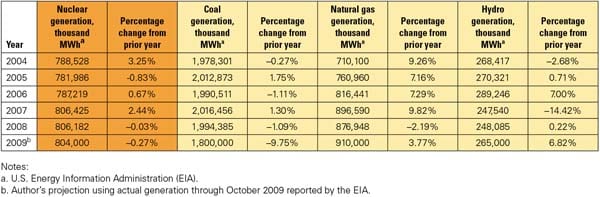
Table 2. Nuclear power remains the leader. Nuclear electricity production has remained rock-solid while other electricity generation technologies have experienced wide production variation. The nuclear industry average capacity factor has remained stable, above 90% for the past several years, far exceeding all other technologies while still maintaining the lowest busbar cost in the industry. Sources: EIA, Nuclear Energy Institute
One key reason for the solid performance of the nuclear power industry over the past decade is the quality of the plant staffs and their dedication to the safe use of nuclear energy to produce electricity. There is no single statistic available to compare the quality of employees across the nuclear industry, or any industry for that matter, so benchmarking plant staffing is the next best statistic. It’s a numbers game with the winner being those plants that can most efficiently use their limited pool of talent.
A New Set of Benchmarking Data
Our first nuclear benchmarking article, "Benchmarking Nuclear Plant Operating Costs," was published in the November 2009 issue of POWER with the cooperation of the EUCG Nuclear Committee (see sidebar), and we promised more would follow. In that article we introduced the EUCG Nuclear Committee as an association of utility professionals representing all 104 nuclear plants in the U.S. as well as those located in China, Canada, France, Japan, Romania, and Spain. The committee’s primary goal is to benchmark plant metrics for nuclear plant operating cost, staffing, and performance data. Having previously reported on plant operating cost benchmarks, this article continues with U.S. nuclear power industry staffing benchmarks.
Before jumping into the data, a few caveats are required. POWER has exclusive access to the EUCG nuclear committee database, but that access has limitations. For example, the data presented do not differentiate between nuclear power technologies, such as pressurized water or boiling water reactors. Also, none of the data have any uniquely identifying information and are as submitted by each plant. Finally, plant staffing data in this article are limited to three categories of workers, although the database has a much more comprehensive breakdown of job categories.
Each of the 104 U.S. nuclear power plants is a member of the EUCG, so if your company is a member, the detailed benchmarking data are available to you through your committee representative. The detailed database is a rich repository of benchmarking data and information that can be sliced and diced as your data needs require. The database also has the tools to help you carve out an appropriate peer group of plants for much more detailed benchmarking studies.
Plant Staffing Trends
Average plant staffing at U.S. nuclear power stations peaked in the 1970s and 1980s with 1,500 workers or more per unit. Coincidentally, the then-moribund industry reported average plant capacity factors hovering around 60% through much of the 1980s. Since 2000, the industry average capacity factor has remained close to 90% following a renaissance in construction and operating and maintenance process improvements implemented in the 1990s. Nuclear refueling outages are also extremely manpower-intensive. In 1991, the industry’s average refueling outage duration was 106 days. By 2000, the length of a typical refueling outage was reduced to 44 days; it dropped further, to 38 days, in 2008.
Left unanswered is the question of whether staffing at nuclear plants has been cut beyond what was economically justified — to the point where key capabilities have been compromised. One recent indicator of this latter trend is the rise in the number of worker fatigue incidents since 2000. Because fatigue degrades workers’ critical skills and abilities, the Nuclear Regulatory Commission (NRC) has taken steps to address worker scheduling, the needs of an aging workforce, highly variable workloads, and factors related to specific tasks in new guidelines covering specific work hour and break limits and minimum day off requirements. The guidelines — NEI06-11, "Managing Personnel Fatigue at Nuclear Reactor Sites" and NRC RG 5,73, "Fatigue Management for Nuclear Power Plant Personnel" — went into effect on October 1, 2009.
Another significant trend in the U.S. nuclear power industry is consolidation of a large number of plants under a single operating company. This approach allows the sharing of best practices and a centralized staff of technical experts while cutting costs.
Most plants also endured a period of "right sizing" in the 1990s to reduce plant nonfuel operating costs, about 50% of which are staffing costs. The operational achievements of the nuclear industry over the past decade are all the more remarkable given that average plant staffing has been reduced by a third or more since 2000.
As the total number of nuclear plant workers (Figure 1) and average plant staffing levels (Figure 2) have remained constant over the past few years, outages to replace steam generators and other major plant equipment have increased, as have outages for plant power uprates (see "Nuclear Uprates Add Critical Capacity," May 2009). The staffing distribution for all nuclear plants by category is shown in Figure 3. Plant quartile staffing levels are shown in Table 3. Note that all the data reported in this article are calculated as full-time equivalent (FTE) workers.
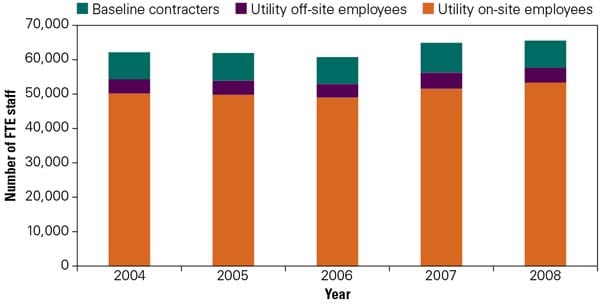
1. Total U.S. nuclear industry average staffing by plant (2004–2008). Staffing includes on-site and off-site employees and baseline contractors. The split between worker groups has remained reasonably constant over the past five years of reported data. Source: EUCG

2. Industry average number of workers at U.S. nuclear power plants (2004–2008). Average plant staffing, including on-site and off-site employees and baseline contractors, has changed less than 1% over the past five years of reported data. Source: EUCG
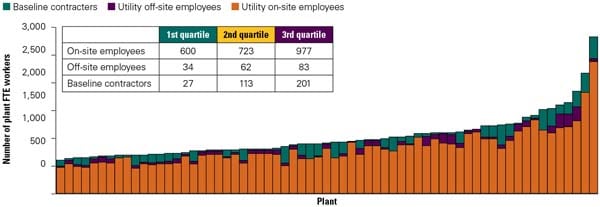
3. Full-time equivalent staffing at each U.S. nuclear power plant in 2008. Source: EUCG
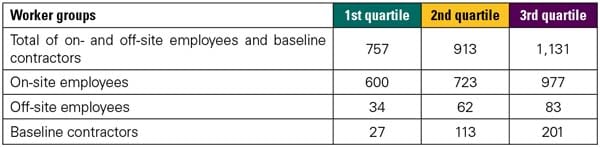
Table 3. Statistical distribution of classes of workers per plant at U.S. nuclear power plants in 2008. Each statistic is calculated independently, thus the columns may not sum to the column total. Source: EUCG
The downside to merely counting FTEs is that this metric does not account for worker productivity. The best metric for overall worker productivity must be the quantity of electricity generated by a plant. For the purposes of this discussion, total generating costs are defined as the sum of plant support and other costs, fuel, and capital costs in a year. This definition is consistent with that used in the prior benchmarking article.
To calculate the staff productivity metric, the total generating costs are divided by the FTE at a particular plant. Data were then arranged into industry quartiles. Figure 4 illustrates the nuclear industry’s staffing productivity for 2008; Figure 5 illustrates the staffing productivity trend over the past three years. The names of the plants in each quartile of these two figures are different and are available only from the original data set provided to the sponsoring organizations. The staffing productivity for all nuclear plants by worker category is shown in Figure 6. Plant quartile staffing levels are shown in Table 4.

4. Total U.S. nuclear industry generating cost per full-time equivalent worker in 2008. The statistics are calculated by summing the cost categories of plant support and other costs, fuel, and capital; that total is then divided by the number of full-time equivalent workers at each nuclear plant (Figure 2). Total generating cost is the sum of plant support and other related costs, plus fuel, plus capital costs, divided by the plant’s FTE workers. Source: EUCG
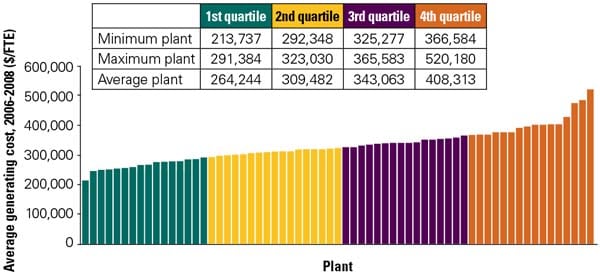
5. Average generating cost of each U.S. nuclear power plant per full-time equivalent employee (2006–2008). The statistics are calculated by summing the cost categories of plant support and other costs, fuel, and capital; that total is then divided by the number of full-time equivalent workers at each nuclear plant (Figure 2). Source: EUCG
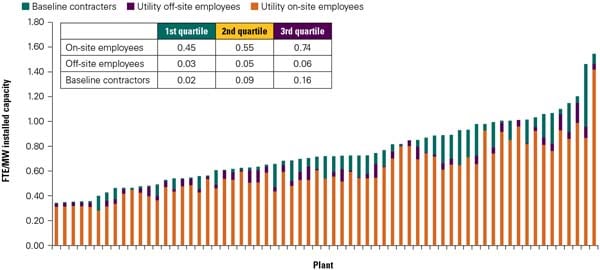
6. Annual full-time equivalent staffing at each U.S. nuclear power plant per unit of installed capacity in 2008. Source: EUCG
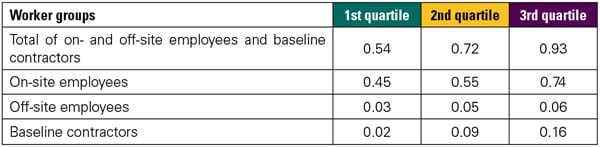
Table 4. Benchmarking worker productivity. Statistical distribution of classes of nuclear workers per unit of installed capacity at U.S. nuclear power plants in 2008. Each statistic is calculated independently, thus the columns will not sum to the column total. The data are shown in FTE workers per MWh of electricity produced. Source: EUCG
The data indicate that the productivity of the bottom two quartiles of plants slipped in 2008 while that of the top-quartile plants has remained constant over the reporting period. This trend may show that the large nuclear operating companies have a built-in staff productivity advantage over the smaller nuclear utilities that is growing. In 1991, 101 individual utilities had some ownership interest in a nuclear power plant. Today, the top 10 nuclear utilities own more than 70% of the U.S. nuclear capacity, according to the World Nuclear Association.
—Dr. Robert Peltier, PE is POWER‘s editor-in-chief.