Nuclear hot streak continues
U.S. nuclear power plants kept operating at high levels of safety and efficiency in 2005, according to performance indicators compiled by the World Association of Nuclear Operators (WANO). Nuclear power accounts for 19.4% of American electricity production.
For the fourth time in the past five years, the U.S. nuclear industry’s unit capability factor—a measure of efficiency—topped 90%. The 90.3% capability factor for 2005 was within one percentage point of the 91.2% record set in 2002 and matched in 2004. Unit capability factor represents the percentage of its maximum output that a plant supplies to the electric grid. It is limited only by factors within the control of plant managers.
Nuclear plant capacity factors also remained high, at 89.6% (Figure 1). Collectively, U.S. nukes outperformed all other plant types (Table 1). The top 25% of the nuclear plant fleet (Quartile 1) remained strong, with a three-year rolling average capacity factor of 96.5% (Figure 2). As a group, even the least productive nuclear plants (Quartile 4) outperformed the average for all coal plants in the U.S.
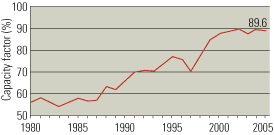

1. Future is bright. The U.S. nuclear power industry continues to set new performance records. 2005 data are preliminary. Sources: Nuclear Energy Institute, U.S. Energy Information Administration, Global Energy Decisions

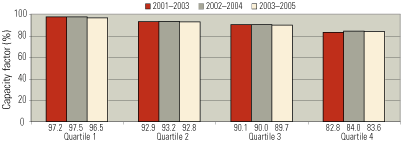
2. On a roll. U.S. nuclear industry capacity factors by quartile (three-year rolling average). 2005 data are preliminary. Sources: Nuclear Energy Institute, U.S. Energy Information Administration, Global Energy Decisions
Last year, U.S. nuclear plants produced 783 billion kWh, nearly equaling 2004’s all-time record of 789 billion kWh. That was remarkable performance, considering that more than 40% of the nation’s 103 nuclear reactors were shut down for refueling last spring, compared with 25% in the spring of 2004.
The U.S. nuclear power sector also sustained near-record safety performance in areas such as safety system reliability, worker safety, unplanned automatic reactor shutdowns, and protection of workers from radiation exposure. “The stellar 2005 performance indicators exemplify the nuclear industry’s ability to achieve excellence over a period of many years,” said Frank L. “Skip” Bowman, president and CEO of the Nuclear Energy Institute. “The performance measures clearly demonstrate that the U.S. continues to be a world leader in safe and secure nuclear plant operation.”


Table 1. U.S. capacity factors by plant type for 2005 (based on preliminary data). Sources: Nuclear Energy Institute, U.S. Energy Information Administration, Global Energy Decisions
The performance data compiled by WANO are analyzed by the Atlanta-based Institute of Nuclear Power Operations (INPO), which promotes excellence in U.S. nuclear power plant safety and operations. INPO uses the data to set challenging benchmarks against which plant safety and operation can be measured. Other highlights of the U.S. nuclear power industry’s performance in 2005 include:
- Unplanned automatic reactor shutdowns. The median industry value was zero per plant for the second year in a row and for the eighth time in the past nine years. In 2005 the industry had the fewest number of unplanned automatic shutdowns since WANO began collecting data. In 2003, the only year in this recent span when the median industry value was not zero (0.8 per plant), unplanned shutdowns at nine plants were caused by the August 14 blackout that affected much of the Midwest and East Coast.
- Safety system reliability. For the 11th straight year, 94% or more of key safety systems met industry goals for availability. The three key safety systems at nuclear facilities are two main cooling systems and the backup power supplies used to respond to unusual situations.
- Last year, 96% of the key safety systems met their availability goals. Because nuclear plants are built with two redundant safety systems, one set of systems is always available, even during maintenance of a component of the other set.
- Unplanned capability loss. This number is a measure of how much time a plant spends off-line or cannot produce its rated output. A low value reflects the success performance of plant equipment and material condition programs. For 2005, the median unplanned capability loss was 1.6—matching the record set in 2001 and below the industry’s goal for the year of 2.
- Worker safety. Records through 2004 compiled by the U.S. Bureau of Labor Statistics confirm that nuclear plants are among the safest workplaces in any industry. U.S. facilities continue to experience very low industrial accident rates. In 2005 there were only 0.24 industrial accidents per 200,000 work-hours, a near-record low and below the industry’s goal for the year.
- Worker radiation exposure. The WANO indicators showed that collective exposure of nuclear plant employees to radiation remained well below federal safety standards. However, the exposure at both pressurized-water and boiling-water reactors was slightly higher last year than in 2004. The rise was due in large part to the upgrading of equipment that the Nuclear Regulatory Commission requires plants to do to have their licenses extended for 20 years.
For more information, visit www.nei.org, www.wano.org.uk, or www.nrc.gov.
Who’s winning in U.S. wind power
The American Wind Energy Association (AWEA) recently released its annual snapshot of wind power development in the U.S. Each year, the AWEA ranks purchases and sales of wind energy and turbines by state, supplier, owner, and buyer. Together, the rankings provide a useful measure of the size, breadth, and growth of the American wind power sector.
Last year, the industry easily broke its record for new installed capacity by commissioning more than 2,400 MW in 22 states (Table 2). The final 2005 tally of 2,431 MW raised total U.S. wind power capacity to 9,149 MW, a year-on-year increase of more than 35%.
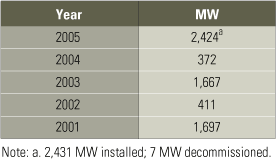
Table 2. Net gains in annual U.S. wind power capacity. Source: AWEA
The roller-coaster pattern of wind power development between 1999 and 2004 reflected the uncertainties caused by expirations and after-the-fact extensions of the federal wind energy production tax credit (PTC). In 2005, for the first time in its history, Congress extended the PTC—now at 1.9 cents/kWh—for two years before it expired. The early action boosted investors’ confidence in the wind power sector, restoring positive momentum to project development.
At the same time, more states are requiring utilities to buy—and retail—more electricity generated from renewable resources (see p. 4). States want the jobs and cleaner air that “green” power projects produce. Utilities don’t mind the renewable portfolio standards because their two consequences—greater diversity in generation fuels and lower overall fuel costs—are beneficial from strategic and bottom-line perspectives. For all these reasons, new U.S. wind capacity is expected to top 3,000 MW this year.
AWEA rankings tell the rest of the story and provide a reference point for the recently accelerated growth of U.S. wind power, which has long lagged that of European nations. “Wind energy’s continuing expansion, as reflected in the rankings, provides fresh evidence that it is becoming more competitive with conventional power sources,” said AWEA Executive Director Randall Swisher. “Wind is a clean, safe, domestically abundant, and affordable energy source, and one of our best options going forward.”
Now, on to the AWEA rankings (based on data for December 31, 2005).
Top states, by installed capacity. At the end of last year, California was still the leader in installed wind power capacity—as it has been since 1981, when its first turbines arrived (Table 3). But Texas gained fast last year and is expected to become No. 1 this year.

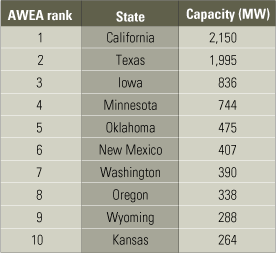
Table 3. Top states, by installed capacity. Source: AWEA
Two large projects came to fruition in Oklahoma last year—the 147-MW Weatherford Wind Energy Center and the 151-MW Blue Canyon II project. Wyoming, which was fifth in last year’s ranking, was overtaken not only by Oklahoma but also by New Mexico (which added 140 MW of wind power in 2005), Washington (which added 149 MW), and Oregon (75 MW).
Largest U.S. wind farms. Wind farms have been getting bigger to maximize economies of scale. The Horse Hollow Wind Energy Center in Taylor County, Texas, joined the ranks of the top five “single” facilities in 2005 (Table 4). AWEA considers a wind farm “single” if its owner(s)/builder(s) are the same and it is geographically contiguous.
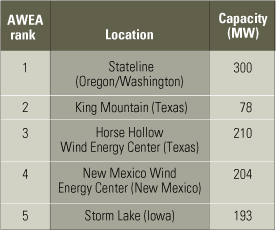
Table 4. Largest U.S. wind farms. Source: AWEA
Largest U.S. holdings. FPL Energy still dominates the ownership ranking (Table 5). Its fleet also grew fastest in 2005, adding another 500 MW. PPM Energy jumped from fifth in the previous year’s ranking to second by adding nearly 400 MW last year. The company has stated that its goal is to have 2,300 MW of wind generation in operation by 2010. MidAmerican Energy, in third place, leads the ranks of utilities building and owning wind power for their customers’ use. Caithness Energy and Edison Mission Group were newcomers to the top five this year.
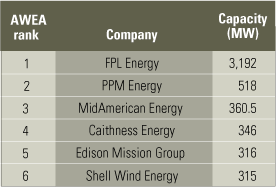
Table 5. Largest U.S. holdings. Source: AWEA
Largest wind turbine suppliers, by installed capacity. Turbines from GE Energy dominated the U.S. market in 2005 (Table 6), accounting for nearly 60% of the new capacity added. Vestas was a distant second with a 30% market share. Rounding out last year’s top five are Mitsubishi, Suzlon, and Gamesa; each now has a factory in the U.S.

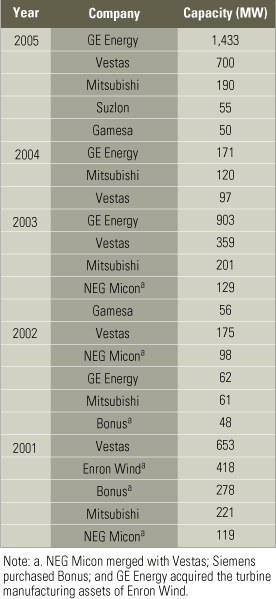
Table 6. Largest wind turbine suppliers, by installed capacity. Source: AWEA
Largest wind power buyers, by capacity. With commitments to purchase 1,048 MW on its books on December 31, 2005, Xcel Energy nosed out Southern California Edison (SCE)—the traditional leader—at the top of the list of purchasers of U.S. wind power capacity (Table 7). The competition between the utilities looks set to intensify: Xcel has announced its intent to buy 775 MW of new wind power capacity for its Colorado system by 2007; SCE has contracts to purchase 393 MW from facilities still under construction.

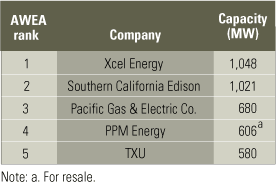
Table 7. Largest wind power buyers, by capacity. Source: AWEA
For more information on wind energy growth in the U.S., visit www.awea.org.
Canadian wind picking up, too
Edmonton-based EPCOR Utilities Inc. celebrated the start-up of its Kingsbridge I Wind Power Project in Ontario on April 6, nearly three months ahead of schedule. All 22 turbines of the 40-MW wind farm (Figure 3) now are putting kilowatt-hours onto Ontario’s electrical grid. The facility is expected to produce 109,000 MWh annually.

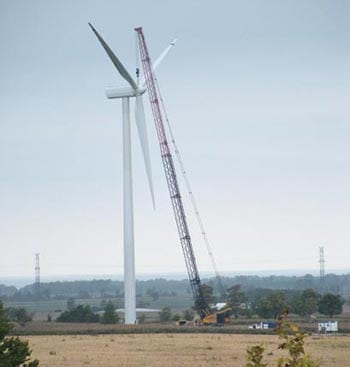
3. Start of something big. The first 136-foot-wide rotor blades being installed at EPCOR’s Kingsbridge Wind Power Project near Goderich, Ontario, last year. Twenty-two turbines standing 250 feet tall now provide the provincial grid with 40 MW of capacity. Courtesy: EPCOR
“We’re pleased to be helping the province meet the energy needs of Ontarians,” said EPCOR Senior VP Paul McMillan. “We thank the community for their support in getting Kingsbridge I completed ahead of schedule and for helping us get the next phase of the project—Kingsbridge II—started.”
In November 2005, EPCOR signed a power-purchase agreement with the Ontario Power Authority for the entire capacity of Kingsbridge II, now under construction to the north. Kingsbridge II will have 69 wind turbines and a nameplate capacity of 160 MW.
As of January 2006, Canada had a total installed wind power capacity of 683 MW.
Brazilian port powers itself
As one of the largest container ports in Brazil, the Port of Pecém (Figure 4) ships out 60% of the products exported from the State of Ceará. To ensure that its electrical infrastructure remains reliable as traffic increases, two years ago the port began augmenting kilowatt-hours from the local utility with natural gas–fired peaking and standby engine-generators from Cummins Power Generation.
“In Brazil, power isn’t always very reliable. There are often random outages that can wreak havoc with tight international shipping schedules,” explained Marcilio Rocha, coordinator of the secretary of infrastructure of the State of Ceará.

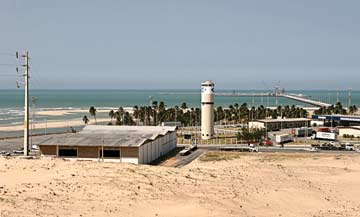
4. Power for port protection. The Port of Pecém, one of the largest in Brazil, uses on-site engine-generators to power equipment and machinery during peak demand periods. Courtesy: Cummins Power Generation
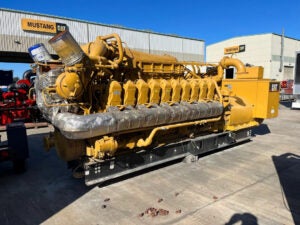
The port’s on-site system consists of three 1750GQPB lean-burn engine-generators (Figure 5) with a total capacity of 5.25 MW and a diesel genset with “black-start” capability. The load on the units varies with the port’s activity level but rarely exceeds 2 MW. “By far the largest load is refrigeration for fruit, said Rocha. “But the Cummins gas generators can handle the port’s entire demand should the situation arise.”

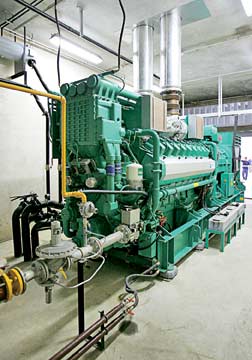
5. Power three-peat. One of the three 1750GQPB lean-burn, natural gas–fired engine-generators at the port. Courtesy: Cummins Power Generation
Since their installation two years ago, the gas engine-generators have not only made port operations more reliable, but more economical as well. Running weekdays during the peak demand period of 5:30 to 8:30 p.m., the gensets produce power at one-third the cost of supply from the local utility, according to Rocha.
Compliance with a new international standard for port security has been yet another benefit of the backup gensets. The International Code for Protection of Ships and Port Installations (ISPS Code) now requires all major ports worldwide to be capable of powering their loading equipment and other machinery in the event of a local utility outage. To date, 162 countries have signed the ISPS Code. On June 17 of last year, the Port of Pecém was certified as the first Brazilian port compliant with the new standard.
Biomass meets CHP in Sweden
The Lextorp combined heat and power plant in Trollhättan, Sweden, 40 miles northeast of Gothenburg, was fully commissioned in early April (Figure 6). The biomass-fueled plant (from Helsinki-based Wärtsilä Corp.) began supplying heat to the district heating network of Trollhättan’s municipal utility last December and generated its first electricity on January 12.

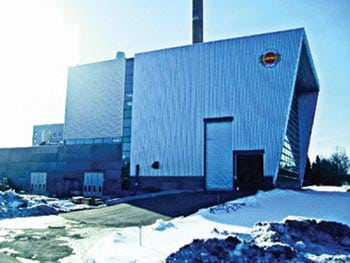
6. Cashing in their chips. This new biomass-fueled combined heat and power plant in Trollhättan, Sweden, relies on a Wärtsilä BioPower 5 DH boiler/turbine/generator that burns wood chips. Courtesy: Wärtsilä
According to Mats Johansson, managing director of Trollhättan Energi, “We’re a growing community, and we’d like to power that growth with something other than traditional fossil fuels. About 95% of Trollhättan’s district-heating needs now come from wood chips, a renewable energy resource. We consider the investment we’ve made economically sound, both for us and our customers.”
At the heart of the Lextrorp plant is a Wärtsilä BioPower 5 DH boiler/turbine/generator that burns by-products from the local forestry industry. It has a thermal output of 17 MW and an electrical output of 3.5 MW.
The BioPower plant (Figure 7) operates on a closed steam/feedwater system separate from the district heating water system. Steam generated in a watertube boiler is supplied to a backpressure steam turbine that drives an alternator. Turbine exhaust steam then heats water for district heating, with condensate used as feedwater for the boiler. Patented Wärtsilä BioGrate combustion technology ensures that biofuels are burned efficiently, with low emissions of NOx and CO.

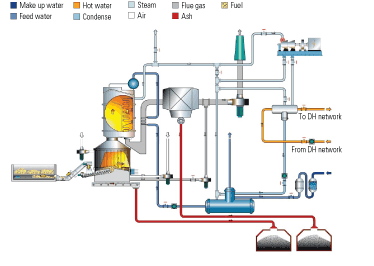
7. Component-level view. A process flow diagram for the Wärtsilä BioPower 5 DH unit. Courtesy: Wärtsilä
Power surfing from Scotland to Germany
Voith Siemens Hydro Power Generation GmbH has announced that it will supply the technology for the first wave power station in Germany. The nominal capacity of Germany’s first near-shore power plant will be 250 kW, with estimated annual electricity production of 400 MWh.
Voith Siemens Hydro’s Wavegen subsidiary developed and operates the world’s first commercial-scale, grid-connected wave power station (Figure 8). The Limpet (Land Installed Marine Powered Energy Transformer), with a nominal capacity of 500 kW, is located on the Scottish Isle of Islay (Figure 9).

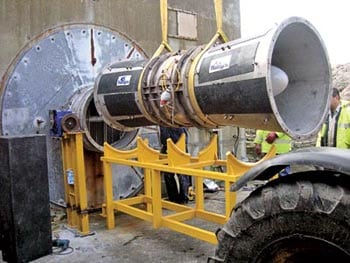
8. Marine megawatts. The Limpet wave power system on a test stand prior to installation. Courtesy: Wavegen


9. A shore thing. A complete 500-kW Limpet at home on Scotland’s Isle of Islay. Courtesy: Wavegen
“The project planned for Germany is a milestone on the road to the commercial use of marine energy, and we’re proud to contribute with our technology,” said Dr. Hubert Lienhard, president and CEO of Voith Siemens Hydro. “The trust that our partners EnBW and the government of Lower Saxony have placed in Wavegen oscillating water column [OWC] technology confirms that we are leaders in this field.”
OWC-based plants generate electricity by exploiting the compression and decompression of air within a chamber as a column of water inside it rises and falls due to wave motion. In the case of the Limpet plant (which has been optimized for annual average wave intensities of 5 to 8 kW/ft), the water column is connected to a pair of counter-rotating Wells turbines that are in turn connected to 250-kW generators.


