Wind is not a new power generation technology. It was one of our principal sources of energy, along with wood and water, prior to the carbon era. However, the use of renewables in the pre-carbon age was very different from the current use of renewables. Today, people rely on energy being available 24 hours a day, 7 days a week, 365 days a year, regardless of whether the sun shines, the wind blows, or there are high or low water levels. We now have over 1,000 GW of generating plants and a large and elaborate electrical grid that requires great coordination among system operators to avoid disruptions.
Also, in the pre-carbon energy era, when renewables were the sole source of energy, there were no coal-fired or natural gas–fired power plants to provide back-up power (Figure 1). Studies have found that the efficiency of those carbon-based plants is affected by incorporating wind energy into the system. When a plant’s efficiency is reduced, its fuel consumption and emissions increase, causing unintended consequences that wind proponents do not disclose. Requiring ever-larger amounts of renewable energy through renewable portfolio standards will only exacerbate this problem.
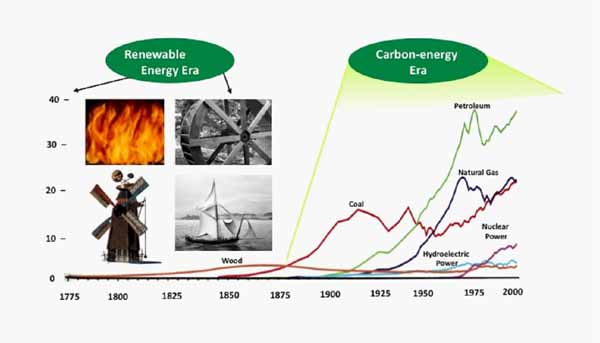
1. The renewable to carbon-energy era in the U.S. Numbers are in quads. Source: Energy Information Administration, Annual Energy Review
Recent studies have been done with actual data to evaluate the impact that cycling has on pollution and carbon dioxide emissions. Energy modelers evaluating the impact of legislation such as Senator Jeff Bingaman’s American Clean Energy Leadership Act and the American Power Act proposed by Senators John Kerry and Joe Lieberman should take note for their models most likely are underestimating the cost of compliance by incorrectly modeling the integration of wind power into the electricity grid.
Substitution Technology
Our various electricity generating technologies were designed and constructed to meet electricity demand based on their best operating characteristics for meeting portions of the electricity load duration curve. The load duration curve illustrates periods of constant demand that are served by baseload power versus periods of intermediate and peak demand. Owing to their high capital cost, low fuel cost, and high capacity factors, technologies such as coal and nuclear were designed to operate continuously to meet the baseload demand component. Owing to their lower capital costs but higher fuel costs, natural gas technologies, including combined-cycle and turbine plants, were designed to meet intermediate and peak electrical load.
Wind is an intermittent technology because it can generate power only when the wind blows. Its low operating cost (with no fuel component) and the mandates of state renewable portfolio standards (RPSs) make it practically a “must take” technology for system operators. RPSs require that a certain amount of electricity generation be produced by renewable fuels. The renewable target mandates tend to start out low but increase over time, with those of most RPS states reaching 15% to 30% by 2020 or 2025. Wind tends to be the primary technology for meeting RPS targets, because it is lower in capital cost than solar thermal and photovoltaic technologies, the other politically acceptable “green” technologies.
Part of the rationale for introducing RPSs is that the substitution of “green” technologies for carbon technologies is supposed to reduce pollution emissions as well as carbon dioxide emissions. However, studies have shown that this may not be the case. As conventional generation (coal or natural gas) is reduced to make room for wind generation and is then increased as wind generation subsides, its heat rate rises. The heat rate is a measure of a generating station’s thermal efficiency commonly stated in units of Btu per kilowatt-hour. This reduction in efficiency increases its fuel consumption and emissions. When sudden increases or decreases occur in generation output, it is referred to as “cycling.”
The Bentek Study
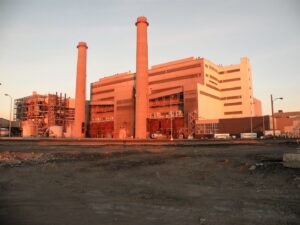
Bentek did a study of the results of integrating wind into the generation mix of the Public Service Company of Colorado (PSCO), using data from the company’s financial reports, the Energy Information Administration, the Federal Energy Regulatory Commission, the Environmental Protection Agency, and the National Renewable Energy Laboratory. PSCO is a largely coal-fired utility with 3,764 MW of coal-fired generators, 3,236 MW of gas-fired combined-cycle and gas turbine capacity, 405 MW of hydro and pumped storage capacity, and 1,064 MW of wind generators. Colorado has an RPS that required 3% of the electricity generated by investor-owned utilities come from qualifying renewable technologies by 2007 and 30% by 2020.
Colorado’s energy demand is highest during the day, peaking in late afternoon or early evening. Wind generation, however, is greatest between the hours of 9 p.m. and 5 a.m.; it cannot be counted on to provide power when most needed, and so it is used when available to meet the RPS. Most of the time that wind generation is available, it backs out (or replaces) natural gas. However, there are times when coal generation, which provides over 50% of PSCO’s baseload generation, is backed out to make room for the wind generation. When this happens, coal generation is cycled, causing its heat rate to increase and resulting in more fuel consumption and emissions. In PSCO, coal cycling predominates because of the low amount of gas generation in the system because most of its gas-fired generation is from turbines and because wind is strongest at night when coal use is even more pronounced (Figure 2).
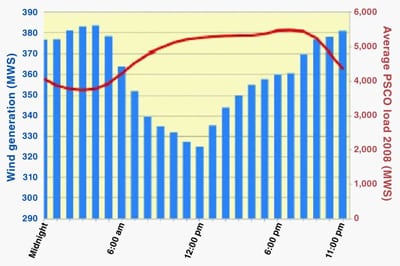
2. Wind blows strongest between 9:00 p.m. and 5 a.m., when electricity demand is weakest. Source: NREL and FERC 714 filings
In the Denver nonattainment area, PSCO has four coal-fired plants: Arapahoe, Valmont, Pawnee, and Cherokee. Between 2006 and 2009, these coal-fired plants experienced higher emissions ranging from 17% to 172% higher for sulfur dioxide, 0% to 9% higher for nitrous oxide, and 0% to 9% higher for carbon dioxide. In 2008, Cherokee even switched to a lower sulfur coal, but still ended up with sulfur dioxide emissions higher by 18%. And, between 2006 and 2009, these plants reduced their generation by over 37%, exacerbating further the increase in emissions.
Because the PSCO data are limited, Bentek checked its results against data from the Energy Reliability Council of Texas, whose utilities are required to report generation levels by fuel every 15 minutes. Texas has the most wind capacity in the country—over 9,500 MW. Texas also has an RPS that was instituted during George W. Bush’s governorship that pushed Texas ahead of California in wind capacity during 2006. The Texas renewable portfolio standard requires that utilities have 5,880 MW of renewable capacity by 2015, including a target of 500 MW of renewable energy capacity from resources other than wind. The legislation also set a target of reaching 10,000 MW of renewable energy capacity by 2025, although it will be exceeded much earlier. However, even in Texas, which has a large natural gas–fired capacity base, with over 40% of its generation being natural gas–fired, coal-fired generation is cycled as is shown in Figure 3.
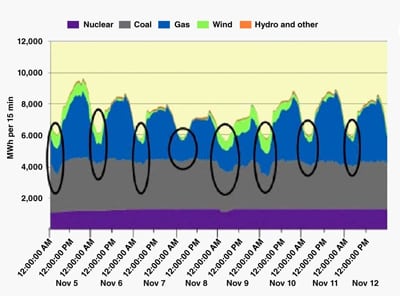
3. Coal plants are cycled as wind generation increases in ERCOT (November 5–12, 2008). Source: BENTEK Energy
Another benefit that wind power generators get is that their forecast power generation entails no penalty if it is not available. Other generators must provide their own back-up power if their generation is suddenly unavailable. Nevertheless, the owners of wind generators believe that they can’t be held accountable for whether the wind blows and thus for inaccuracies in their forecasting capability. For example, on February 26, 2008, a cold front moved through West Texas and rendered wind’s output 1,000 MW less than promised, and that unexpectedly had to be made up by other generating technologies. Only careful and extensive coordination, such as was carried out in West Texas on that cold February day, can divert brown outs and black outs from occurring.
The Netherlands Experience
Two researchers, C. le Pair and K. de Groot, found that the Netherlands Government was overestimating the amount of carbon dioxide reductions associated with wind production. The government was using incorrect data because it did not correct for the reduction in efficiency of the conventional power plants once wind was introduced into the system. Using data provided by CBS, the Dutch Institute for Statistics, the researchers made an estimate of the “turning point” where the efficiency reduction of conventional power plants balances out the fuel savings from wind energy. Using data for 2007, when wind power was at 3%, they found the turning point to be at an efficiency reduction of 2% based on all the power stations serving the Netherlands. That is, when the efficiency of the back-up plants was reduced by over 2% due to cycling caused by the integration of wind energy into the system, fuel use and emissions of the back-up plants increased.
Heat Rate Simulations
An engineer, Kent Hawkins, evaluated several heat rate simulations to represent cycling of the plants when wind is introduced into the system. One set of simulations evaluates wind energy replacing coal power with different technologies serving as the back-up power to wind, in order to evaluate their effect on fuel use and carbon dioxide emissions. He found that because of cycling, carbon dioxide emissions increase with the incorporation of wind energy if coal is the sole back-up power for wind. If coal and gas turbines or gas combined-cycle and gas turbines are used to back up the wind power, carbon dioxide emissions are reduced mainly due to the lower carbon dioxide emissions produced from natural gas generators as compared to coal generators. This is best seen by examining the last bar in the Figure 4 where the lowest carbon dioxide emissions result when natural gas combined-cycle plants are solely used to replace coal. The original study can be found here.
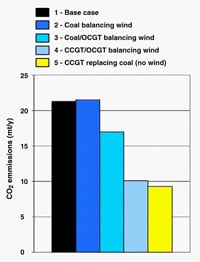
4. Carbon dioxide emissions under several cycling scenarios. Source: www.masterresource.org
An interesting consequence of this analysis is that certain areas of the world where wind is integrated into a system that is primarily coal-based may see an increase in total carbon dioxide emissions as a result of using wind in their generating sector. That is, in these circumstances, wind would not be providing an offset in carbon dioxide emissions but would actually be providing an increase in those emissions. China, for example, relies on coal for 80% of its generation and natural gas for only 2%. China also added the most wind power of any country in 2009, 13 GW, ranking third in the world in total wind capacity, with the U.S. first and Germany second. Because China’s wind would primarily be backed up by power from coal-fired generating units, it is no wonder that China’s carbon dioxide emissions increased by 9% in 2009.
Closing Thoughts
As more wind units are built and data become available regarding their integration into conventional energy systems, we will learn more about the effects of wind units on the operation of conventional plants. A few studies have been done showing that the effect of wind integration on both fuel consumption and emission reductions can in fact be negative. Further evaluation of our current wind units and their effects on fuel consumption and emissions should be done before increasing the penetration of renewable energy to the 20% and 30% levels currently mandated by some state renewable portfolio standards, and before a national renewable portfolio standard is considered for enactment.
Portions of this article appeared previously on the Institute for Energy Research and Master Resource websites.
—Mary Hutzler is a distinguished senior fellow for the Institute for Energy Research and formerly the top energy analyst for the Energy Information Administration, where she specialized in data collection, analysis, and forecasting. Hutzler also served as acting administrator in 2001.