In the competitive power market that exists today, utilities must utilize data to optimize their assets. With proper analysis, individual units, as well as fleets of plants, can balance operating costs, efficiency, and reliability, maximizing value to companies’ bottom lines.
Competition dynamics within the power generation industry have never been more intense than those that exist today. The prices of fuel and power, variance of technologies, and numerous other drivers require companies to be agile and vigilant to ensure asset competitiveness. The potential exists for short-term financial decisions to overshadow a long-term strategy that better positions a company for success.
To maintain both short-term viability and long-term sustainability, it is important for companies to fully employ one of their most valuable resources—their data. Data analytics can be used as an effective tool to optimize plant efficiency and reliability, which will in turn contribute to economic success. The most effective asset management and optimization systems are data-driven—valuing and utilizing data as a foundation to support informed decision-making that brings long-term value.
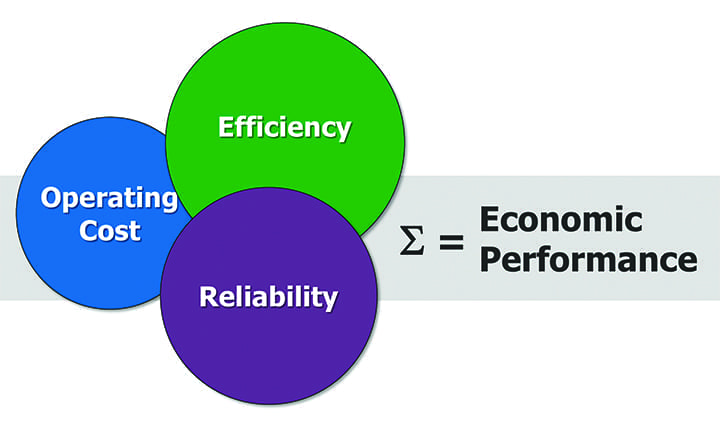
Consider three primary keys to success within the power generation industry: operating cost, efficiency, and reliability (Figure 1). During economically challenging times, the “quick” answer may lead to a focused emphasis on reducing operating costs. Caution should be used, however, before making this conclusion. As depicted in the graphic, the “keys” are interrelated—they are all important to the overall economic performance of the facility. Emphasis in one area will have a direct (or indirect) influence on the others.
 |
|
1. Keys to success in power generation. Courtesy: Solomon Associates |
Using Data Advantageously
Without effective data analytics, the likelihood exists for the development and execution of projects or operational changes with too narrow of a focus on a specific benefit. In other words, a company may end up focused on efficiency for the sake of controlling efficiency, headcount for the sake of controlling headcount, and spending for the sake of controlling spending. As stated previously, data in the real world is all interrelated. Spending, or lack thereof, can affect efficiency positively or negatively. People decisions, such as hiring, workforce reductions, and training, can also affect reliability performance positively or negatively. These singularly focused decisions, in effect, could result in sub-optimization, which positively impacts one area and negatively affects another.
As part of the data analytics equation, it is important to clearly understand the asset’s “market mission”—a factor that will likely vary from company to company, and even asset to asset. For example, reliability is typically of highest importance to a cogeneration facility, whereas operating cost may be of greatest priority to an electric-only power producer.
The quantity of data available at a power generation facility is typically not in question. What to do with the very large sum of data produced is worth discussing. A few related points and examples to consider follow.
Operational Data. Assessing event data can identify negative trends and facilitate root cause analysis that will minimize the potential for repeat events. As an example, cogeneration facilities are typically very effective at this assessment because of their market mission for high reliability. Data research reveals the equivalent forced outage rate (EFOR) at cogeneration facilities is 40% better than their equivalent electric-only peers.
Root cause analysis with follow-up action planning and execution is a proven method for eliminating repeat events. Additionally, findings at the plant level can (and should) cascade across the fleet to minimize the potential for a similar repeat failure—thereby improving availability (and revenue) for the entire fleet and company. There are numerous related benefits that can result from addressing issues that are identified through operational data analysis.
Financial Data. It is important to understand the all-in cost of operating and maintaining a facility as if it was an independent business entity. Organizing financial accounting records to include segmentation of fixed and variable expenditures at the plant level and the allocated corporate expense is an important starting point. Effectively utilizing a computerized maintenance management system (CMMS) to be able to understand where the maintenance dollars are being spent is equally important.
Another benefit of developing a consistent methodology for collecting financial data is for plant-by-plant comparisons. Although the market mission may vary between plants—thus justifying differing priority levels of expenditures—spending categories can be analyzed to determine if there are “opportunity areas,” such as materials or service agreements, at both the plant and fleet level.
Market Data. Understanding the value of the commodity being produced is highly important in determining if the asset is a contributor or detractor to the bottom line of the business. The commodity could include electrical energy sold onto the grid, steam provided to the host for cogeneration facilities, ancillary services provided, etc.
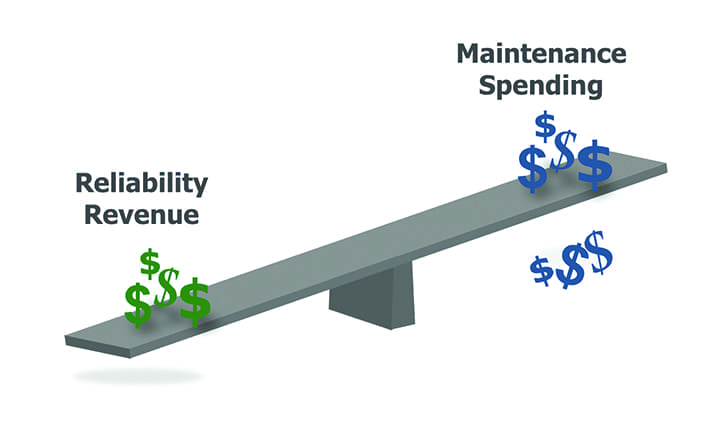
Data analytics can be effectively used to assess the relationships that exist between reliability and maintenance spending. There is a balance to be considered (Figure 2). Important points to consider in this balance, based on numerous years of data research, include the following:
- ■ It is not possible to “cost-cut” your way to improved reliability.
- ■ Maintenance costs are driven by reliability (or lack thereof).
- ■ Effective data analytics includes a combination of both maintenance spending and reliability to find the right balance for each asset.
 |
|
2. The balance between reliability revenue and maintenance spending. Courtesy: Solomon Associates |
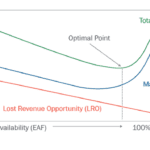
These points are reinforced in Figure 3, which includes a curve of EFOR volatility relative to non-fuel operations and maintenance costs plus capital expenditures. As represented in the graph, the balance is achieved when operating on the flat portion of the EFOR volatility curve, particularly in the “sweet spot,” where spending and EFOR volatility are controlled. The red areas on the curve represent the following points:
-
-
- ■ Unreliability can be the effect of underspending.
-
- ■ Overspending can be the effect of unreliability.
-
 |
|
3. Relationship between reliability and non-fuel operations and maintenance (O&M) costs plus capital expenditure (CapEx) spending (EFOR = equivalent forced outage rate). Courtesy: Solomon Associates |
Making the Right Choices
As referenced throughout this article, the effective use of data analytics can lead to informed business decisions that ultimately have a positive impact on the bottom line. One such example is provided by a mid-sized utility company based in the U.S. The management team knew they could not operate the way they historically had been and survive in the competitive market in which they operated. They carefully analyzed their operations, made operational and budgetary improvements that were complementary, then monitored the progress.
The impact of their improved operational reliability and trailing operational expenditures is represented in Figure 4. As depicted on the graphs, making informed business decisions based on data led to sustained performance.
 |
|
4. This graph shows an actual six-year trend in EFOR versus operational expenditures (OpEx) for a mid-sized U.S. utility that implemented a data analysis-based strategy. Courtesy: Solomon Associates |
In summary, effective data analytics can provide a balanced approach in the key areas of operating cost, efficiency, and reliability. Intentionally analyzing the operational, financial, and commercial reliability data, while keeping an eye on the interrelationships in the data, power generation facilities can effectively justify improvement projects or operational changes that will avoid sub-optimization and instead ensure the most beneficial impact to the bottom line, finding the “sweet spot”— for both the short and long term. ■
—Cliff Watson is a consultant with Solomon Associates.