In the power generation industry, it is challenging to find enough resources to address all your needs. On top of that, the power business operates in volatile markets with changing price signals and competitive forces. Energy companies must be prepared to adapt and change to deliver top asset performance. You need to routinely question existing operational and maintenance processes and explore new ways to improve. How can you uncover opportunities to optimize production of your current assets?
Solomon Associates provides data-driven, strategic, and tactical insight across the energy industry, which leads to greater efficiency, reliability, and profitability. By leveraging an extensive non-public operational database, along with a library of best practices, our expert industry consultants identify your operational gaps with peers and deliver insight to help you close those gaps and improve results. Since 1998, more than 10,000 power units have relied on the results of Solomon’s Worldwide Power Generation Performance Analysis (Power Study) to better understand their power plant performance. We deliver data-driven insight to help you more effectively manage financial and human resources, improve asset performance, minimize commercial risk, and enhance the competitiveness of your generating units and power blocks.
Please enjoy Part 1 of our collection of industry insight and case studies built for the power market.
Owners of fossil-fired generation facilities have always struggled to find the best balance between maintenance expenditures and plant availability. Without a clear understanding of the right balance, operators can underspend, resulting in availability risk, or they can overspend with a corresponding negative impact on profitability. Few companies can determine this balance themselves due to the need for years of unit-specific historical data. Even when data are available, emerging maintenance issues within a plant and varying market dynamics (such as fuel price volatility, new generating capacity, wholesale electric market margins) can render data more than a few years old unreliable for decision making.
Defining the optimum point also requires operating data across all ranges of availability. However, generation owners do not have sufficient time to experiment and determine the cost/availability relationships as they must focus on meeting short-term business demands.
To address this challenge, Solomon created a methodology that utilizes its Maintenance Index®, Lost Revenue Opportunity® (LRO™) and frontier analysis tools along with the industry calculation of Equivalent Availability Factor (EAF) to determine the target optimum point.
Quantifying the Market Dimension
The Maintenance Index is used to determine historical maintenance spending. The index is defined as a 2-year average of non-overhaul expenditures plus the annualized portion of the most recent overhaul and major project expenditures divided by the current and previous years’ average production in megawatt-hours (per generating unit).
EAF is used as a measure of availability. This represents the maximum production a unit can generate, accounting for partial and full outages.
LRO is the opportunity cost for the generation lost due to the unit being unavailable. Including this economic factor into the analysis, the total cost describing the operations of the unit is the sum of the total maintenance cost plus the plot of LRO as shown in Figure 1.
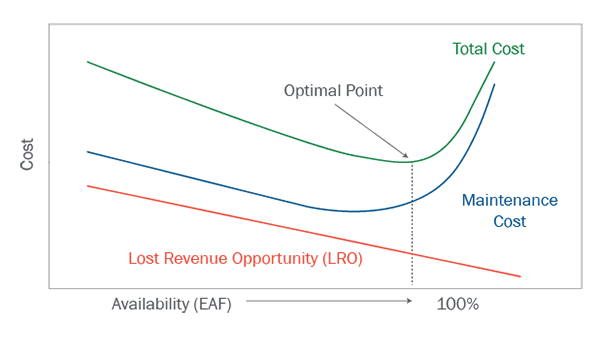
Figure 1. Total Cost vs Availability
The inflection point of the total cost curve represents the optimum balance between maintenance spending and unavailability losses. As availability approaches 100%, total costs increase exponentially, possibly beyond market value. In other words, the incremental cost to run the unit at higher availabilities is greater than the associated increase in incremental revenue.
Analytical Method
Solomon used frontier analysis, a numerical technique used to estimate the boundary or limits of a data set, to identify the optimum target. Using validated operating and financial data, the technique envelops rather than intersects the data, thus creating a “frontier” of performance that represents what is achievable as opposed to what is theoretical. In terms of this analysis, the frontier points are defined as the values that have the lowest Maintenance Index for a given average EAF interval. These points were used to develop an analytical curve that represents the “frontier” of Maintenance Index as a function of average EAF as presented in Figure 2.
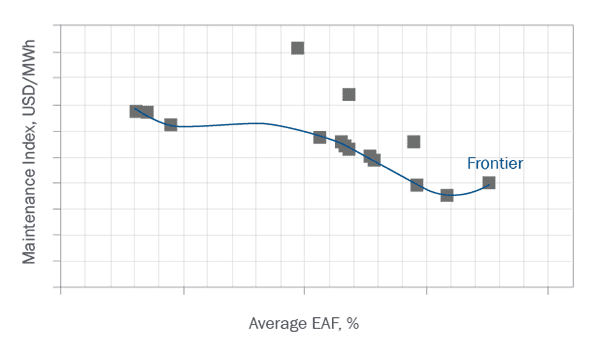
Figure 2. Frontier Development
A Sample Application
Consider, for example, a nominal 700-megawatt (MW) unit that burns solid fuel and has a net capacity factor (NCF) of 62%. Using the algorithm represented by the blue line in Figure 2 and superimposing the unit-specific LRO curve yields the total cost curve presented in Figure 3 (see below).
It is important to note that LRO results can significantly vary year to year depending on market conditions. To be consistent with the other variables in the analysis, not only does the LRO value applied here need to be specific to the unit under analysis, it also needs to be computed over a multi-year period.
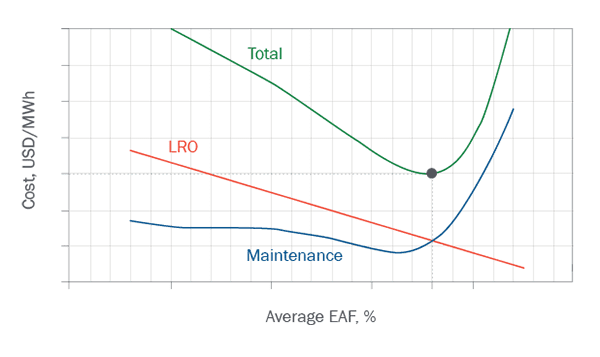
Figure 3. Optimum Operating Point
Given the unit-specific curve, the target for this unit should be at an average EAF corresponding to the total value point immediately above the intersection of LRO and maintenance curves. This position represents the optimum balance between availability and maintenance spending considering the LRO when this unit moves to the frontier of best performance. At this point, the associated maintenance (spending) index would be slightly more than a minimized Maintenance Index. However, achieving this frontier may not be practical within a short period of time. Intermediate goals may be needed to work programmatically toward reaching the frontier. Using this analysis will yield these targets regardless of whether the goal is to achieve best performance or an intermediate level of performance.
Access the Complete Collection.
This article is a high-level overview of a recently published collection of case studies and insight. Curious to learn more? Discover new ways of using your data to maximize tradeoffs and improve asset performance and optimization of your power generation plant. Access the complete collection of insight for the power market.