To say that today’s generation planners have a tough job is a gross understatement. A number of unprecedented challenges face the industry, including how to replace retiring coal generation and prepare for a rebound in load growth.
With natural gas prices at historic lows, it is no surprise that the answers to these questions often include natural gas. In the planning world, however, what looks good today is just that, and a proper "no regrets" strategy for generation planning must incorporate a wide range of possible eventualities. Among these possible futures, of course, is a larger-than-expected rise in natural gas prices, a scenario that harks back to the overbuild of gas generation in the early 2000s.
Over the past decade, the nation has become overwhelmingly reliant on the combined-cycle gas turbine, or CCGT, plant for the majority of capacity additions. In total since 2002, 158,847 MW of CCGT capacity has been added, making up more than 56% of all capacity additions.
The build-out was spurred by low natural gas prices in the late 1990s coupled with higher costs and environmental concerns for coal plants. The natural gas prices began to rise in the early 2000s, however, hitting as high as $8.69/MMBtu on average in 2005, leaving many CCGT plants underused on the sidelines (Figure 1).

1. Low natural gas prices in the 1990s led to a rapid build-out of CCGT plants, many of which went unused as gas prices rebounded in the 2000s. Source: EIA, SNL
While high natural gas prices put the brakes on CCGT development in the mid-2000s, CCGT plants have still accounted for 35% of all capacity added since then, closely followed by wind, with 33% of capacity additions. Coal capacity additions have totaled less than 14% of capacity added since 2006, but this number is likely to fall off even more under the U.S. EPA’s announced CO2 emissions standards for new sources.
Capacity in Development
Relatively stable and cheap shale-driven natural gas prices have spurred renewed interest in CCGT development over the past few years as developers look to replace retiring coal generation. In total, 83,831 MW of planned CCGT capacity is in some stage of development, according to SNL Energy data (Table 1).

While significant new CCGT capacity is planned (Figure 2), a large portion of the capacity is only in initial development phases. Of the total 83,831 MW tracked by SNL, 25%, or 21,319 MW, is in the earliest, "announced" stage of development, while 28,550 MW, or 34% of capacity, is in the "early development" phase. SNL’s designation of early development indicates that the project developer has applied for permitting.
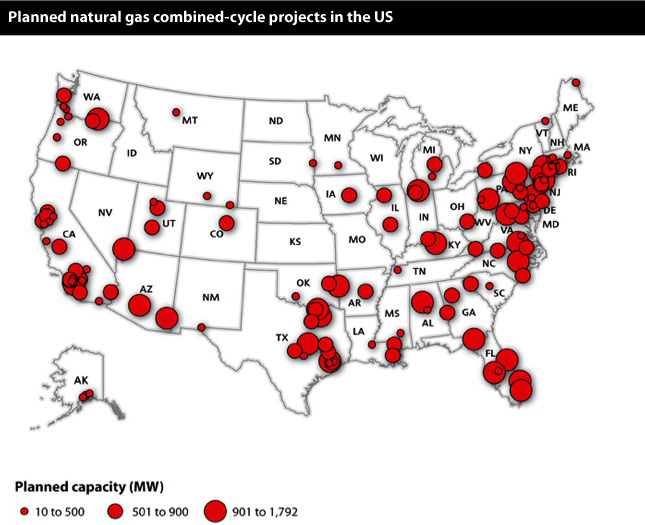
2. Most of the planned CCGT capacity is concentrated in the eastern U.S. Source: SNL
Together, announced and early development CCGT projects account for 59% of all capacity planned, and it is unclear what amount of this capacity will come online. A further 14,486 MW, or 17% of planned capacity, is postponed, with their ultimate fate up in the air.
SNL is tracking 8,624 MW of CCGT capacity in "advanced development" stages, indicating that they may have a higher chance of seeing completion. SNL marks a project as under advanced development if it has completed two of these milestones: signing a power purchase agreement; obtaining financing; obtaining siting permits; signing an engineering, procurement and construction contractor; and securing turbines.
In addition, 10,853 MW of CCGT capacity is under construction.
Looking at the timeline for expected project completions, 33,681 MW of capacity has an expected online date by the end of 2015. That year has the highest amount of capacity expected to come online, at 12,526 MW, and this may be an indicator that a significant number of CCGT projects are being developed to replace coal capacity that may retire due to the EPA’s upcoming Mercury and Air Toxics Standards, or MATS, set to take effect in 2015.
Just over 14,000 MW of planned CCGT capacity has an announced online date between 2016 and 2022, while SNL is tracking 35,912 MW that does not have an expected online date.
Figure 3 summarizes future CCGT capacity for each year-end through 2020 under two extremes. Under one extreme, all projects with an expected online date are added to current installed CCGT capacity of 235,153 MW to determine a maximum possible future CCGT capacity for each year if all CCGT project capacity comes online as currently planned. In the other extreme scenario, only projects currently in advanced development or under construction are added to current CCGT capacity to determine a future capacity amount.

3. At least 250 GW of CCGT capacity should come online by 2020. Future CCGT capacity is expressed as the possible end-of-year capacity for the specified year. Values for 2012 are built off current installed CCGT capacity less any expected retirements in 2012 plus any capacity expected to be completed in 2012. Values for future years are calculated by taking the prior year’s value and subtracting any expected retirements in the specified year and then adding any capacity expected to be completed in the specified year. The "with all planned capacity” figures include all planned capacity expected to be completed in the years shown, while the "With just under construction and advanced dev. capacity” figures only include planned capacity expected to be completed in the year shown that are in an advanced development or under construction status. Source: SNL
If all projects come online as currently planned, 268,779 MW would be installed by the end of 2015. If just projects under construction and in advanced development are considered, this number drops to 252,166 MW. Including all planned capacity, 282,703 MW would be online by the end of 2020, though this drops to 253,275 MW if just projects under construction and in advanced development are considered. These two scenarios set an upper and lower bound for future CCGT capacity based on current projects, and the future is likely to be somewhere between these two values.
To provide some more insight into planned projects, SNL organized CCGT capacity by development status and number of years since the project was first tracked by SNL (Table 2). The data shows that 12,085 MW of CCGT projects have been initiated within the past year, with 5,869 MW still in an announced phase, while 6,216 MW have applied for permitting and moved into the early development phase.
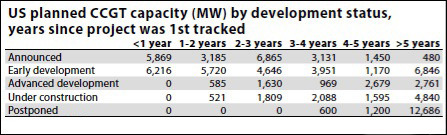
Projects first tracked between one and two years ago make up just over 10,000 MW, with most of this still in announced and early development stages. Only 585 MW was able to move into advanced development within one to two years, while 521 MW was able to begin construction.
Looking by development status, the majority of projects under construction have been tracked by SNL for four years or longer, indicating fairly significant lead times for projects to make it from the announced stage to the construction phase. Most of the projects in the advanced development stage, 8,016 MW, have been tracked by SNL for four years or more.
Interestingly, a significant amount of capacity, or 6,846 MW, in early development has been tracked for five years or longer.
Where Is Capacity Being Planned?
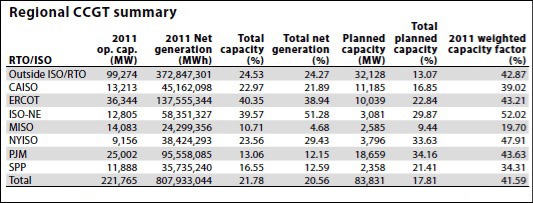
Among the nation’s independent system operator, or ISO, regions, PJM Interconnection LLC has the most CCGT capacity planned, at 18,659 MW (Table 3). Of this, 4,674 MW has been tracked for less than one year, with an additional 4,451 MW first tracked between one and two years ago. A number of projects are probably being developed to replace retiring coal units in the region. PJM coal capacity slated to retire in 2016 or earlier amounts to just over 14,000 MW.
In a recent PJM capacity auction for 2015-2016, a record amount of new generation, energy efficiency and growth in demand response resources helped to mitigate the impact of coal plant retirements in holding down prices. Speaking on a May 21 conference call, Andy Ott, PJM’s senior vice president of markets, said: "The real story of this auction is, what you saw was a significant shift between retiring coal plants and a significant amount of both new gas-fired generation offered and [an] unprecedented amount of demand response. What you saw was a shift in the generation mix away from some of the older coal plants to gas plants."
Another region wrangling with coal retirements is the Midwest ISO, and as with PJM, replacement of retiring capacity with gas-fired generation is a key strategy. At a media briefing at the National Association of Regulatory Utility Commissioners’ summer meeting in Portland, Ore., in late July, MISO executives discussed the growing interconnectedness of natural gas and electricity.
MISO expects that about 12,000 MW of coal capacity will retire because of upcoming emissions rules from the EPA, but due to high reserve margins in the region and a great deal of legacy demand response, only about 6,000 MW will need to be replaced. MISO’s vice president of transmission, Clair Moeller, said at the NARUC meeting, "We need 6,000 MW from somewhere, and demand-side management and gas are kind of the only options."
Moeller and others at the meeting spoke about the challenges that a move toward more gas in the region creates, including requiring significant investment in gas infrastructure such as gas storage and pipelines.
SNL data shows that 2,585 MW of CCGT capacity is planned in MISO, only 400 MW of which is under construction.
Both the California ISO and the Electric Reliability Council of Texas Inc. (ERCOT), which have significant installed CCGT capacity, also have a large volume of planned CCGT capacity. The Cal-ISO has 11,185 MW of CCGT capacity planned, with 2,737 MW under construction and the remainder in announced or early development phases. ERCOT has 10,039 MW planned, though none is under construction.
The Players
SNL data shows that there are 119 distinct owners of planned CCGT capacity. Utilities have just over 17,000 MW of planned CCGT capacity, with public power companies and electric cooperatives planning to add an additional 6,725 MW.
The bulk of planned capacity, or 60,101 MW, comes from other developers and is reminiscent of the build-out of the early 2000s, which was dominated by independent power producers, or IPPs. Capacity planned by IPPs may be most susceptible to cancellation because it is more dependent on market conditions. Currently, 12,506 MW of planned merchant CCGT capacity is postponed, and only 5% of total planned capacity for this group is under construction. The majority of merchant CCGT capacity in development, 39,030 MW, is in just an announced or early development stage, 9,200 MW of which was first tracked four or more years ago.
NRG Energy Inc. leads all companies for planned CCGT capacity, with 4,761 MW in some stage of development (Table 4). The company has 2,354 MW of installed CCGT capacity. NRG recently announced plans to merge with another large IPP, GenOn Energy Inc., which has 1,246 MW of CCGT capacity in development and 3,039 MW installed.
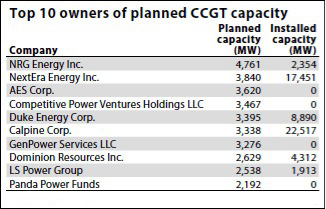
NRG’s planned CCGT capacity comprises 550 MW under construction, 2,919 MW in announced or early development stages, and 1,292 MW that is postponed. All of the planned capacity for future partner GenOn is in announced or early development stages.
NextEra Energy Inc. follows NRG, with 3,840 MW in development through its regulated utility subsidiary Florida Power & Light Co., NextEra is no stranger to CCGT development, with 17,451 MW installed.
AES Corp. has 3,620 MW of CCGT under development but none currently installed, though it does have more than 4,000 MW of operating gas-fired steam turbine capacity and 1,600 MW of gas peaking capacity. To date, AES has been heavily reliant on coal generation but has announced a number of coal unit retirements for the coming years.
In an Aug. 6 Form 10-Q, AES indicated that low natural gas prices are putting pressure on the company’s coal fleet, reducing output from its plants in the eastern Midwest in particular. These factors combined with EPA rules may place additional pressure to mothball or retire more coal generation.
The company intends to replace some of the retiring coal generation with CCGT capacity. As an example of this, AES subsidiary Indianapolis Power & Light Co. issued a request for proposals June 28 seeking 600 MW of CCGT capacity starting June 2017 to replace a similar amount of coal-fired generation retiring at the Eagle Valley and Harding Street plants.
The Projects
Currently, 22 CCGT projects are under construction, comprising 10,853 MW and more than $12 billion in potential investment.
The largest project under construction is the 1,329-MW Warren County Power Station in Virginia (Table 5). The project, owned by Dominion Resources Inc. subsidiary Virginia Electric and Power Co. d/b/a Dominion Virginia Power, is expected to be completed in 2014 at an estimated construction cost of $1.1 billion.
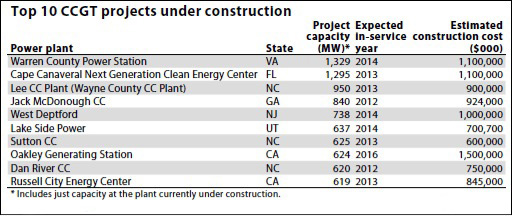
The Warren County project is part of a move by the company to increase gas-fired capacity in its generation portfolio. At a May 8 hearing concerning Dominion Virginia Power’s integrated resource plan [http://www.snl.com/InteractiveX/doc.aspx?ID=13259677], the company faced criticism that the plan relied too heavily on gas-fired generation and did not incorporate enough demand-side management and renewable resources.
Florida Power & Light’s 1,295-MW Cape Canaveral Next Generation Clean Energy Center is the second-largest CCGT project under construction and is expected to be completed in June 2013 at an estimated cost of $1.1 billion. The project is part of NextEra’s strategy to move toward more regulated operations to offset negative market fundamentals that are affecting a number of companies across the country.
Duke Energy Corp.‘s 950-MW Lee CC plant in Wayne County, N.C., is another of the largest CCGT projects under construction. The plant is at the same site as the 417-MW Lee coal plant, which is slated to retire in September. Also replacing coal-fired generation for the company is a 625-MW CCGT plant near Wilmington, N.C., scheduled to go online at the end of 2013.
Issues to Watch
Speaking at a U.S. Energy Association event in Washington, D.C., on Jan.18, Natural Gas Supply Association President and CEO Skip Horvath said: "We just don’t see a black swan in our future. We think all [potential] issues are manageable."
While a number of industry participants may share this philosophy, there were certainly lessons to be learned from the overbuild of gas generation in the early 2000s, and a number of generation planners may be hesitant to rely too heavily on gas-fired generation despite the rosy outlook for shale production.
At a March 20 forum exploring challenges facing the electric power sector, industry leaders cautioned against a headlong rush into construction of natural gas–fired generation and stressed the need for diversification of generation portfolios to hedge against price increases and other risks.
This sentiment was shared by Booz & Co. senior partner Thomas Flaherty, who cautioned the industry about an over-reliance on natural gas when speaking at MISO’s annual stakeholders meeting June 20. Flaherty said natural gas continues to be subject to price volatility and decisions made in 2012 on current gas prices may not accurately portray those costs in the future. "Commodities are very fickle. They’re not predictable," he said. "People are making 60- and 70-year decisions because of today’s gas prices, which doesn’t make any sense."
The threat of volatile and high natural gas prices is likely to remain on the minds of generation planners and is one of the principal concerns companies need to consider as the industry works to replace the nation’s aging coal generating fleet. The NYMEX Henry Hub forward curve as of Aug. 2 had natural gas prices rising to between roughly $3.50/MMBtu and $4.00/MMBtu in 2013, inching up to $5.00/MMBtu and beyond starting in 2019 (Figure 4).
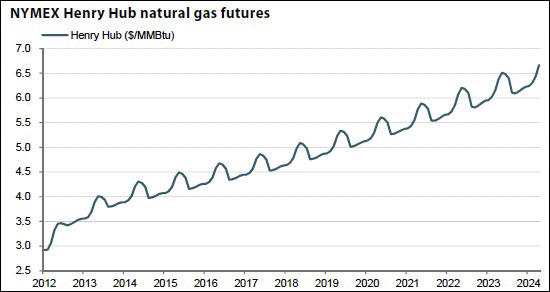
4. Current Henry Hub gas futures have prices rising above $6/MMBtu in the 2020s. Source: SNL, NYMEX
Developers will want to closely watch a number of factors that may affect natural gas prices in the coming years. Perhaps chief among these is the potential for federal regulation of fracking and the possibility for some negative environmental event in shale production that may lead to public backlash. This could be the sort of "black swan" event that is so hard to predict, and the public’s eye will certainly be on shale gas in the coming years with continued public attention through films such as the upcoming "Gasland 2," which is expected to be released later in 2012.
Another question mark for the industry is whether LNG exports will gain approval and what impact these may have on natural gas prices. While prices would be likely to rise to some extent from natural gas exports, many analysts see the impact on prices as relatively modest. Nevertheless, this remains a risk factor that will need to be monitored.
Even if wellhead prices for natural gas remain low, there is also some price risk that may be associated with natural gas infrastructure constraints. As the nation becomes increasingly reliant on gas generation, there will need to be an accompanying development of additional natural gas processing, storage and transportation infrastructure, and this sort of development may face longer lead times than the CCGT plants themselves.
The fate of many of the CCGT projects now planned also may hinge on the number of coal [plant] retirements that stem from upcoming EPA rules. Analysts have predicted retirements of 60,000 MW or more over the next 10 years, but to date less than 30,000 MW of coal retirements have been formally announced through 2022. Some of this should shake out in the coming months as the courts decide the fate of the stalled Cross-State Air Pollution Rule and generators firm up compliance plans for MATS.
—Jesse Gilbert is a senior industry analyst with SNL. This article was previously published on the SNL web site. It is reprinted with permission, with minor edits for style.