The results of stack emissions testing conducted at several coal-fired power plants during the past three years have provided useful guidance for plant operators who are required to meet new federal guidelines regarding the release of particulate matter. The data and guidelines presented here will assist those who operate plants with electrostatic precipitators to develop a strategy for filterable particulate emissions control.
New Environmental Protection Agency (EPA) rules for the control of mercury and air toxics, also known as the Mercury and Air Toxics Standards (MATS), were established in 2012. The air toxics portion of the rules includes control of hydrochloric acid (HCl) and several trace metals. After several years of research, proposals, industry comments, and stakeholder reviews, the EPA has accepted the premise that filterable particulate matter (PM) is a surrogate for virtually all trace metals. In the final MATS rule, the EPA determined that limiting stack filterable particulate emissions below 0.03 pound per million Btu (lb/MMBtu) based on EPA Test Method 5 should adequately safeguard public health.
The specification of filterable PM limits, instead of total particulate matter that included the highly variable condensable fractions, has provided additional flexibility for achieving compliance with existing electrostatic precipitators (ESPs). Fortunately, during the past 50 years, a considerable body of literature has been generated describing research and full-scale operating experience with ESPs. Our approach in this article is to draw from this literature and provide plant operators with empirical means to assess their ESP performance. We review important research on the various parameters affecting ESP outlet emissions. This research summary guides the discussion that follows on the interpretation of results from recent testing at several coal-fired power plants. Areas for further research on reducing stack filterable emissions are also identified.
Fundamentals of Ash and ESP Corona Power
Sulfuric acid is an excellent fly ash–conditioning agent. Proper amounts of this acid can control the ash resistivity to manageable levels, in the optimal range of 108 to 1,010 ohm-cm. It is known that some eastern high-sulfur coals with high iron content in the ash can generate elevated levels of sulfur trioxide (SO3) in the flue gas. Depending on the air heater operation, it is quite possible for these plants to operate the ESPs at a flue gas temperature that is below the sulfuric acid dew point. The fly ash can then become too conductive for proper control in the ESP, as the particles are subjected to the “pith ball” effect, an electrostatic phenomenon through which the particles lose their charge at collector plates and are repulsed back into the gas stream. The resultant electrical re-entrainment can greatly diminish the ESP collection efficiency even if there are no limitations to the introduction of proper corona current density in the ESP.
On the other hand, it is also possible for the fly ash in flue gas to be insufficiently conductive. This has been known to lead to premature flue gas breakdown inside the ESP caused by the incipient “back corona” effect. Back corona severely limits the amount of corona current density that can be received by a given electrically energized section of the ESP. Low ash conductivity (or high ash resistivity) is believed to be caused by a combination of factors:
- Inadequate amounts of free SO3 in flue gas due to the highly alkaline nature of the fly ash.
- A combination of insufficient amounts of SO3 in flue gas and alternate conductive species, such as sodium sulfate, in the fly ash.
- A combination of high acidity in the fly ash, high flue gas temperature, and low flue gas moisture. That can result in much of the SO3 present in the fly ash to be ineffective to adsorb onto fly ash particles, rendering it ineffective for providing the needed conductivity.
Corona Current and Specific Corona Power
Corona current density is defined as the maximum corona current that can be introduced by a power supply per square foot of collecting surface of a given ESP electrical section. The inlet fields of the ESP experience the maximum dust concentrations and are subjected to flue gas breakdown at lower current density levels as compared to cleaner outlet fields. Even in the absence of ash resistivity–induced limitations, it is not unusual for the inlet field corona current density levels to be lower by a factor of four as compared to the outlet fields.
The relationship among corona current density (mA/1,000 ft2), specific corona power (watts/acfm), a nd collection efficiency across an ESP has been well researched. It has been found that when operating an ESP at ash resistivity levels higher than 5 x 10¹⁰ to 5 x 10¹¹ ohm-cm, high ash resistivity-related premature gas breakdown impacts begin to be noticed. ESP corona current density starts dropping rapidly and, depending on the size of the ESP, filterable emissions may start to increase.
In most cold-side ESP applications, corona current density levels could vary from values as low as 5 mA/1,000 ft2 for highly resistive ashes to levels as high as 75 mA/1,000 ft2for highly conductive ashes. Operating voltages will vary, depending on plate spacing and discharge electrode geometry, between 40 and 75 kV, on average.
As an example, for an ESP operating at 40 kV average, and at a corona current density level of 50 mA/1,000 ft2, the average corona power density would be 2.0 watts/ft2. If this level of energization were powered in an ESP with a specific collecting area (SCA) of 200 ft2/1,000 acfm, then the specific corona power would be 400 watts/1,000 acfm. If the SCA were twice as large, at 400 ft2/1,000 acfm, then a corona current density of 25 mA/1,000 ft2 would produce the same specific corona power of 400 watts/1,000 acfm.
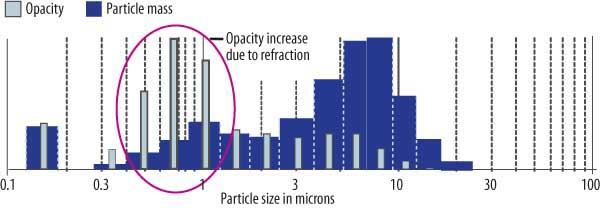
For a given power plant operating at a given load and a given ESP configuration reduced corona current density, changes in coal chemistry, for example, can lead to much reduced specific corona power. This lowering of corona current density has the potential to cause an increase in stack emissions. A given ESP operating with proper mechanical integrity can shift from days and months of very well energized operation to sudden episodes of ESP electrical sections operating with low corona current. While the worsening of ESP collection can generally be seen as increased opacity, as monitored through a continuous opacity monitor at the ESP outlet, caution needs to be exercised. Stack opacity is not always a good indication of increasing PM rates because it is greatly dependent on particle size. Smaller PM tends to have less impact on the PM rate while it has a large impact on refracting and attenuating the light, which is then seen as higher opacity. Conversely, larger PM (such as re-entrainment from hopper leakage) may not impact the opacity monitor, but it can have a significant impact on the PM rate.
There is wide variability in plate-to-plate spacing in the collector electrode ESP designs. Historically, ESP size was reported in terms of SCA and usually in units of square feet per 1,000 acfm. Today’s ESP evaluation practice is to report the ESP size in terms of total residence time. This will avoid the misinterpretation of a lower SCA precipitator at higher plate spacing as a smaller size unit, even though the treatment times for both may be identical. Engineering evaluations and research on the application of wider plate spacing technology have revealed that collection efficiencies of ESPs with two different plate spacing and SCAs can be the same, as long as other parameters such as specific corona power are equivalent.
Performance Variability at a Given Specific Corona Power
ESP filterable emissions can vary considerably for a given specific corona power. This is a result of several factors.
First, ash cohesivity can vary depending on the nature of flue gas and ash constituents. It is well known that ammonia conditioning has reduced filterable emissions considerably, principally due to control of sulfuric acid concentrations and the introduction of a cohesive agent that is a byproduct of the ammonia-sulfur compounds. Several approaches are reported in the literature, such as:
- Injecting ammonia for control of particulate re-entrainment from carbonaceous particulates.
- ESP performance enhancement through ammonia injection on high SO3-laden flue gas on eastern coals.
- Maintaining operation above the sulfuric acid dew point through sufficient mitigation of SO3 by ammonia injection (Figure 1).
 |
| 1. Capturing ash. Control of ash re-entrainment through ammonia injection is one means of reducing filterable emissions. Source: J.T. Reese, J. Greco, Experience with Fly-Ash Collection Equipment Serving Steam-Electric Generating Plants, Journal of the Air Pollution Control Association, August 1968, Vol. 18, No. 8. |
Considerable research with novel additives, showing similar results, has also been conducted for the purposes of reducing ash resistivity and increasing ash cohesivity.
Second, fine particulate matter may vary from plant to plant, depending on fireside conditions. A significant number of coal-fired power plants have introduced some form of fireside management to reduce flame temperature, and thus reduce nitrogen oxide (NOx) emissions. The correlation between fireside NOx emissions and submicron particulate content has been thoroughly researched by the Electric Power Research Institute (EPRI). Figure 2 shows the relationship between nitric oxide (NO) content and submicron particulate concentration for coal-fired boilers of different designs and differing flame temperatures. Note in the figure that submicron particulate matter decreases by more than a factor of three, in direct proportion to the decrease in NO emissions. Other researchers have determined that, for a given specific corona power in the ESP, filterable outlet emissions will decrease if the inlet ESP fine particulate content is decreased considerably.
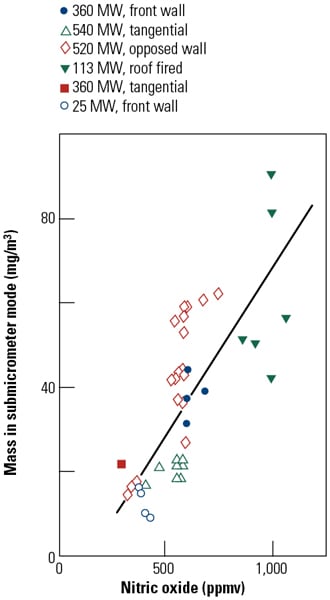 |
| 2. Fly ash in the gas. Fly ash fine particulate content versus NO emissions at several coal-fired plants is illustrated. Source: M.W. McElroy, R.C. Carr, and G.R. Markowski, Size Distribution of Fine Particles from Coal Combustion, Science, Vol. 215, January 1982. |
Finally, ash re-entrainment from ESPs can vary and can affect the filterable emissions considerably. Re-entrainment can occur due to several factors:
- Poor gas flow quality in the ESP, resulting in high local peak gas velocities. These high local velocities in the ESP can scour the particulate from collector plates and increase stack emissions.
- Even a small component of flue gas flow and entrained ash directed to the hopper area can find its way to the stack practically untreated by the ESP, when poorly distributed gas flow is present.
- Excessive sparking in the outlet fields of an ESP, mostly due to outdated power supply controls, can cause re-entrainment of ash collected on the plates. These controllers typically allow the precipitator power to dwell for excessive periods in the de-energized state, before automatically ramping the power back to the sparking voltage level. While the average ESP power in these electrical sections would appear normal, the ESP particulate collection can suffer from re-entrainment due to improper automatic control of ESP energization.
- Excessive collector plate rapping in the outlet fields will release the collected ash back into the flue gas stream. Typically, rapping an abnormally high number of collector plates with a single rapper creates these situations. When rapper intensity levels are set too high, the ESP corona power may continue to show good levels, while the stack filterable emissions could still suffer due to ash re-entrainment.
Wet FGD Co-Benefits Are Possible
The particulate control co-benefits of operating a wet flue gas desulfurization (FGD) system after a dry ESP have been well documented through pilot-scale experiments. Table 1 illustrates the relatively stable total PM outlet loadings for a highly varying set of inlet filterable particulate loadings. Further analysis of this pilot-scale data indicates that filterable particulate collection can reach 90% at wet FGD ash inlet loadings at about 0.10 lb/MMBtu. Other researchers have reported filterable particulate collection in the neighborhood of 90% across a wet FGD (see, for example, K.S. Kumar and P.L. Feldman, “Understanding the Relationship Between Trace Element Removal and Overall Particulate Control,” November 1994, ICAC Forum).
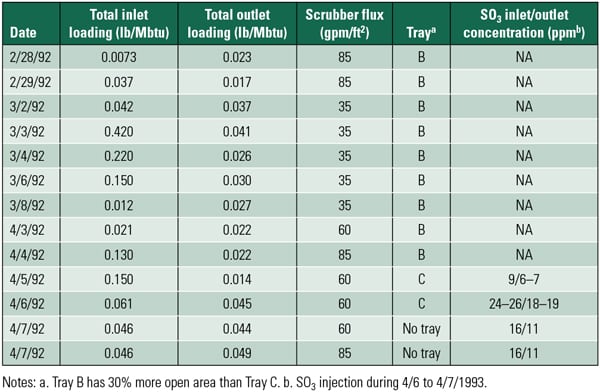 |
| Table 1. Relationship between wet FGD inlet and outlet particulate emissions at a pilot plant. Source: P.A. Bhat and D.W. Johnson, Results of Particulate and Gaseous Sampling from a Wet Scrubber Pilot Plant, 10th Particulate Control Symposium, April 1993. |
However, you should not expect the filterable particulate collection efficiency of 90% across the wet FGD under all conditions. The mechanisms of particulate collection through impaction and impingement in a wet FGD are largely influenced by particulate size distribution entering the absorber. The finer the particulate size of fly ash entering the absorber, the lower the expected collection efficiency should be expected. Also, stack filterable emissions after the wet FGD will be influenced by the degree of re-entrainment of scrubber-generated gypsum particulate from the mist eliminators located at the wet FGD outlet.
SO3 Makes a Contribution
ESP filterable outlet emissions data can vary widely, even for a seemingly consistent level of electrical energization. However, the contribution of artifacts from measurement emissions test methods can introduce considerable positive bias to a true filterable emission value. Figure 3, showing sulfuric acid dew point curves, highlights this phenomenon. EPA Test Methods 5 and 17 (other than Method 5B), generally stipulated for unscrubbed units, require the filter probe temperature to be at 250F or at the stack temperature, respectively. For units operating with a wet FGD system ahead of the stack, EPA Method 5B is typically specified.
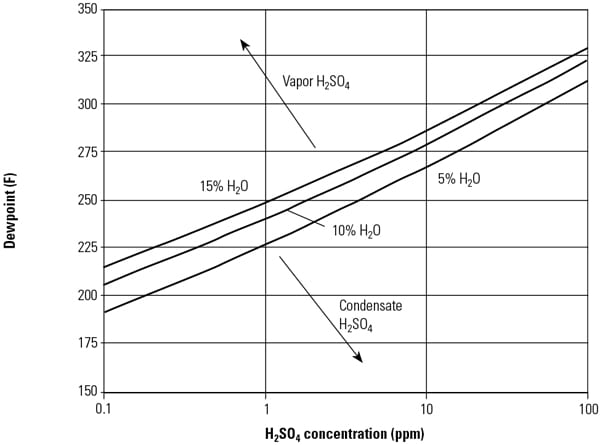 |
| 3. SO3 dew point curve. Metal temperatures below the dew point temperature for a given H2SO4 concentration may form a corrosive acid condensate on its surface. Source: R.R. Hardman, E. Stacy, K. Dismukes, W. Harrison, and L. Monroe, Estimating Total Sulfuric Acid Emissions from Coal-Fired Power Plants, U.S. DOE Conference Fate and Formation of Sulfur Trioxide in Utility Flue Gas Streams, September 1998. |
For an ESP operating at an outlet temperature of 325F and a typical concentration of 10 ppm SO3 at a flue gas moisture level of 10%, the sulfuric acid dew point can be estimated from Figure 3 to be 277F. In this example, the ESP is operating well above the acid dew point. If stack testing is to be conducted at 250F on an unscrubbed unit, assuming that 10 ppm SO3 is present at the ESP outlet, Figure 3 indicates that about 8.5 ppm SO3would have condensed as sulfuric acid aerosol. The extent of positive bias from condensed SO3 will depend on how much of this aerosol gets retained on the front half of the EPA Method 5 sampling train.
Research has shown that the extent of positive bias from SO3 can vary, depending on the ash loading and alkalinity of particulate being caught in the probe. Testing that was done to measure the accuracy of SO3 measurements revealed that as much as 40% of the sulfuric acid can be captured on the filter probe. This amount of positive bias can have considerable impact on the reported test results. A 40% capture rate across the filter probe would amount to 4 ppm SO3. If 4 ppm SO3 is captured on the probe, positive bias on filterable particulate as a result of condensation of SO3 on the filter catch can be as high as 0.015 lb/MMBtu. For ashes that are more alkaline, such as those derived from Powder River Basin (PRB) coals or produced as a result of alkaline sorbents added for SO3 mitigation on eastern coal applications, the capture efficiency of the condensed acid aerosol on filter probes could be higher than 40%.
It is not uncommon for ESPs operating with SO3 conditioning to experience the effects of over-conditioning from time to time. Process control of SO3 injection can be difficult if sulfur and alkaline levels in the coal change considerably. Therefore, it is possible for flue gas at the ESP outlet to be saddled with a substantial level of free SO3 in the vapor phase. EPA-certified PM continuous emission monitors (CEMs) operate at a filter probe temperature specified by Method 5B (320F, plus/minus 25F). At this temperature, for the stated example, condensed sulfuric acid aerosol is unlikely to be present at the filter probe temperature. Operation of the filter probe at this temperature has the most probability of avoiding SO3-related positive bias on the filterable test results.
ESP Performance on Various Coals
Estimated ESP performance curves showing SCA (normalized at 9 in. plate-to-plate spacing) versus collection efficiency are illustrated in Figure 4. The figure demonstrates the expected performance of ESPs when faced with a variety of different fuels. The prediction curves closely correspond with performance estimates reported in the past by EPRI. This early work projected that, for comparable filterable outlet emissions, ESPs treating flue gas from the combustion of low-sodium, low-sulfur western PRB fuels would need to be more than twice as large as ESPs on plants firing higher-sulfur coals. For reasons discussed earlier, the higher resistivity of ash resulting from the firing of PRB coals limits the corona current density in each electrical section to a much lower level. This would result in lower specific corona power for an ESP of similar size designed for eastern coals. The ESP size, therefore, would need to be larger to achieve the necessary particulate collection, as dictated by the specific corona power considerations.
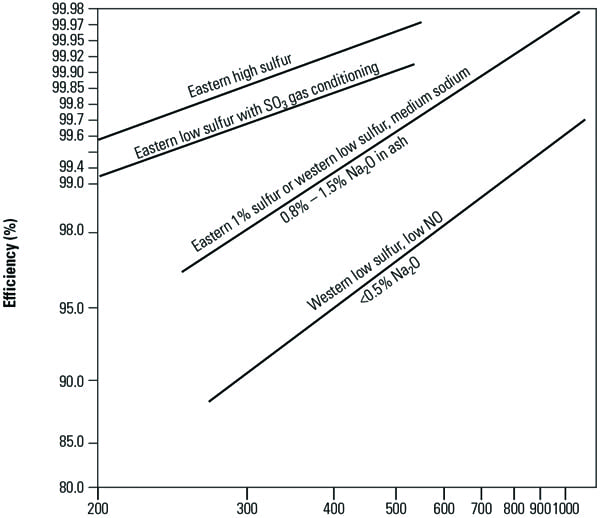 |
| 4. Coal ash collecting. ESP collection efficiency versus specific collecting area (SCA) for various coals in illustrated. Source: K.S. Kumar and P.L. Feldman, Beyond NSPS: Electrostatic Precipitator and Fabric Filter Technologies to Meet Future Emission Control Requirements, 9th Symposium on Transfer & Utilization of Particulate Control Technology, October 1991. |
ESP Performance and Testing Data
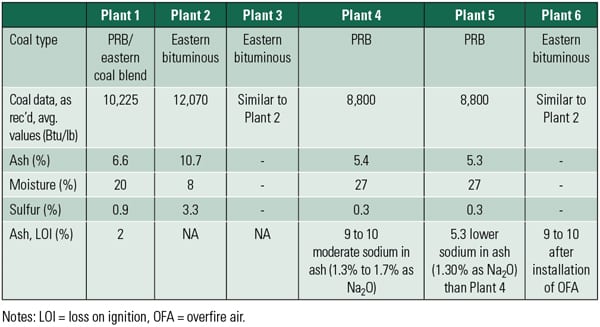
The remainder of this article reports on the stack filterable emissions from six coal-fired power plants, as well as the associated ESP configuration and operating data. The discussion above will be helpful when interpreting the descriptions and test data from each plant. Table 2 shows the configuration of power plant boilers referenced in the stack emissions review. Table 3 lists the properties of coals used at these plants.
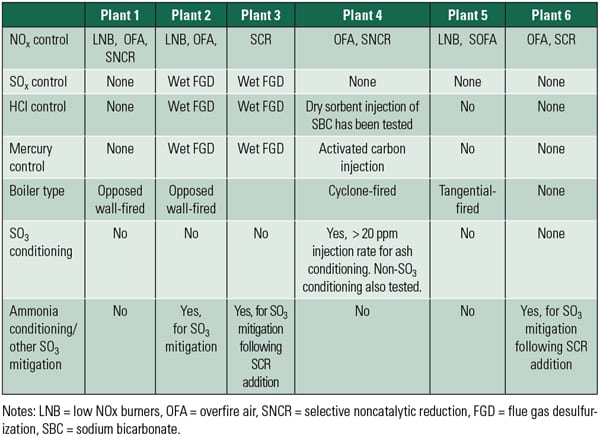 |
| Table 2. Coal-fired power plant configurations of tested units. Source: Babcock & Wilcox Power Generation Group Inc. |
 |
| Table 3. Coal-fired power plant operational information of tested units. Source: Babcock & Wilcox Power Generation Group Inc. |
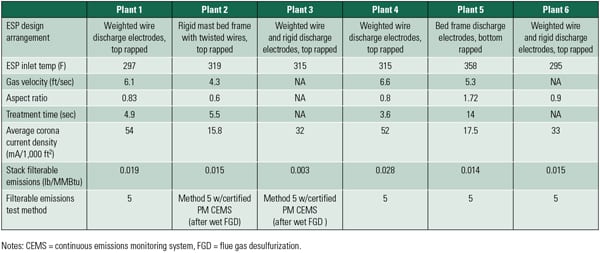 |
| Table 4. ESP operational data from tested units. Source: Babcock & Wilcox Power Generation Group Inc. |
Plant and Fuel Descriptions. Plant 1 is an unscrubbed unit that fires a blend of PRB coal and eastern high-sulfur Pittsburgh No. 8 coal. For NOx control, this plant employs low-NOx burners (LNBs) and overfire air (OFA). The plant also utilizes selective noncatalytic reduction (SNCR) as an additional NOx control. There is no dedicated fly ash conditioning system in use at this plant.
Plants 2 and 3 fire eastern high-sulfur coal. They both utilize open tower wet FGD for SO2 control and LNB and SCRs for NOx control. Both plants also utilize SO3 mitigation techniques to control the increase in SO3 produced after SCRs were installed. Plant 2 utilizes sodium-based injection ahead of the ESPs. Plant 3 utilizes ammonia injection ahead of the ESPs. Plants 2 and 3 are equipped with particulate matter CEMS to monitor stack filterable emissions.
Plant 4 is an unscrubbed unit firing 100% PRB coal. SO3 injection is normally used. Considerable additional testing was conducted with injection of activated carbon for mercury control and sodium bicarbonate for HCl control ahead of the ESPs. To prevent the adverse impact of SO3 on activated carbon injection (ACI) effectiveness, a proprietary, non-SO3-based alternative fly ash conditioning technique was also evaluated.
Plant 5 utilizes 100% PRB coal, but with slightly lower sodium content in its ash as compared with Plant 4. This plant utilizes both OFA and LNB for NOx control. Plant 5 is also unscrubbed and does not use fly ash conditioning.
Plant 6 utilizes eastern high-sulfur coals. It also employs OFA. This plant utilizes ammonia injection to control the increase in SO3produced after SCRs were installed.
Table 4 shows the relevant details of each ESP and the actual ESP operating information during the testing period. Plants 1, 3, 4, and 6 utilize the North American–style ESP design, which consists of single-piece electrodes, weighted wire, and rigid discharge electrode geometries. These designs utilize top-mounted rappers, located outside of the flue gas stream, to dislodge ash collected on both collecting and discharge electrodes. Plants 2 and 5 utilize the European-style ESP design, with multiple-piece discharge electrodes hung between electrode supports in a bed-spring manner.
In sum, the most important parameters affecting ESP performance, as presented in Tables 2, 3, and 4, are:
- Average operating corona current density
- ESP inlet temperature
- ESP residence time
- If ash conditioning or SO3 mitigation techniques have been employed
- Fireside NOx control techniques
- Specific ESP corona power
ESP Corona Current Density Performance. Plants 1, 3, 4, and 6 show operating corona current densities between 32 and 54 mA/1,000 ft2. This is indicative of a well-energized precipitator collecting ash that is well conditioned and properly conductive.
Plants 2 and 5 show operating corona current densities of 15 to 18 mA/1,000 ft2. This is at least a factor of two less than the values reported for Plants 1, 3, 4, and 6 and is indicative of process differences that could result in less-conductive ash limiting the corona current input to the ESPs. The ESP behavior of Plant 5 can be generally explained as due to a combination of variations in the coal’s sodium content and a relatively high operating inlet temperature. However, the reasons for Plant 2 performing at a relatively low operating corona current density level on eastern high-sulfur coal application have not yet been fully researched.
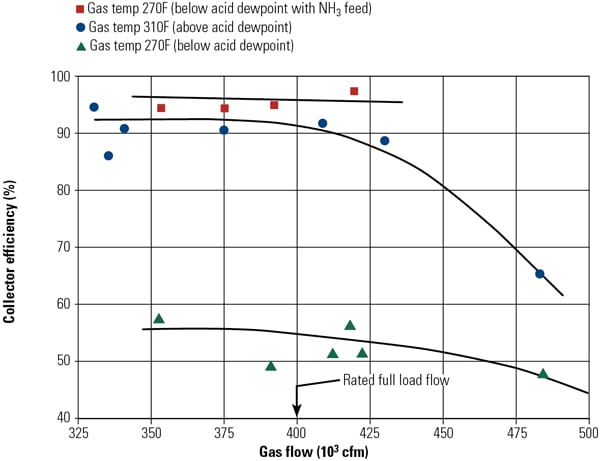
ESP Specific Corona Power Effect on Emissions. Based on operating voltage and current density data on ESPs from these six plants, and their respective SCA, ESP specific corona power values were developed for each of these plants, utilizing the approach discussed earlier in the research review section. Figure 5 plots the stack filterable emissions data collected from each of these plants.
To better understand the relationship between ESP specific corona power and filterable emissions, three separate curves are plotted in Figure 5. First a predicted curve based on SCA versus collection efficiency relationship is developed; second, a trend line based on data from Plants 1, 4, 5 and 6 (all unscrubbed units) is created; and finally, a trend line is added based on data from Plants 2 and 3 (both of which have a wet FGD system following a dry ESP).
From Figure 5, the following observations about the ESP performance on the unscrubbed units is possible:
- Though the predicted values of filterable emissions would be higher than 0.03 lb/MMBtu in most cases based on the Kumar-Feldman line for ESPs operating specific corona power densities of 350 to 400 watts/1,000 acfm, all of the dry ESPs were able to operate below the MATS filterable emissions standard of 0.03 lb/MMBtu.
- Among the unscrubbed units, Plant 4 shows significant additional filterable reductions of 0.015 lb/MMBtu when the ESP was operating with an alternative, non-SO3 fly ash conditioning system.
- Plant 4 was able to retain the same low emission levels with a non-SO3 ash conditioning system even when ACI and sodium bicarbonate injection testing were conducted at this plant, and without loss of the high ESP specific corona power.
- Stack filterable emissions of Plant 2 at the wet FGD outlet following a small, two-field dry ESP operating at specific corona power of about 150 watts/1,000 acfm consistently showed filterable emissions below 0.02 lb/MMBtu. For an ESP-only configuration, the Kumar-Feldman curve predicts filterable emissions in excess of 0.05 lb/MMBtu for the operating specific corona power level.
- At Plant 3, the dry ESP was operating at a specific corona power level of 320 watts/1,000 acfm. The stack filterable emissions after the wet FGD showed values of 0.003 lb/MMBtu from PM CEMS data (utilizing a certified method based on EPA Method 5B). Based on the Kumar-Feldman prediction, a standalone dry ESP would perform at levels much higher than 0.03 lb/MMBtu.
Interpretation of the Observations. Test data on stack filterable emissions have shown that well-operating ESPs can handle both eastern high-sulfur coals and PRB coals. Proper fly ash conditioning seems essential for achieving this result. Several specific conclusions can be drawn from the data collected from the six plants and the observations presented above.
Most promisingly, the stack filterable emissions testing on stations where ESPs are followed by wet FGDs indicate that considerable additional particulate collection can be realized. Additional research seems necessary to determine the mechanisms controlling this important particulate control co-benefit.
These observations have significant implications for plant operators interested in reduced particulate emissions:
- Stack filterable emissions data after wet FGD systems on Plants 2 and 3 cannot be explained without significant additional collection occurring across the wet FGD. Though this co-benefit phenomenon is not altogether surprising based on the research review presented earlier, currently there is a scarcity of publicly available literature validating the particulate collection mechanisms that are possible across a relatively low–pressure drop device such as an open tower wet FGD.
- The trend line of ESP performance on unscrubbed units in Figure 5 indicates a consistent under-prediction by a value between 0.010 and 0.015 lb/MMBtu as compared to the Kumar-Feldman line. Though this represents no more than a 15% difference for older units operating at filterable emissions of 0.10 lb/MMBtu, it could have much greater significance for plants operating near the 0.03 lb/MMBtu level.
 |
| 5. Final test results. Filterable emission versus ESP specific corona power. Note the Kumar-Feldman prediction line that is referenced in this article. Source: Babcock & Wilcox Power Generation Group Inc. |
- Because most of the plants profiled employ some form of fireside modification technique to reduce flame temperature, are these plants also reducing the fine particulate concentrations in fly ash during the practice of this and other NOx-reduction techniques? Additional testing will be necessary to determine if fireside modifications to reduce NOx could also result in reductions of fine particulate matter in fly ash.
- It is significant that the data from Plant 4 indicates a factor of two differences in filterable emissions between ESP operation with SO3 and non-SO3 conditioning agents. Carefully consider the potential damage to probe filters resulting from condensed sulfuric acid as well as the data bias caused particulates collecting on the probe. It appears that all SO3mitigation techniques tend to avoid the bias that acid mist aerosols can introduce into test results.
The testing and analysis also left several unanswered questions that suggest additional research is required to fully understand the impact of ESP performance on filterable emissions:
- What is the explanation for the optimistic ESP performance based on stack testing and evaluation at the six power plants?
- Could the positive bias from condensed SO3 be a factor in the overprediction by the Kumar-Feldman curve?
- Could the past curves of overprediction be a direct result of suboptimum control of ash re-entrainment from ESPs?
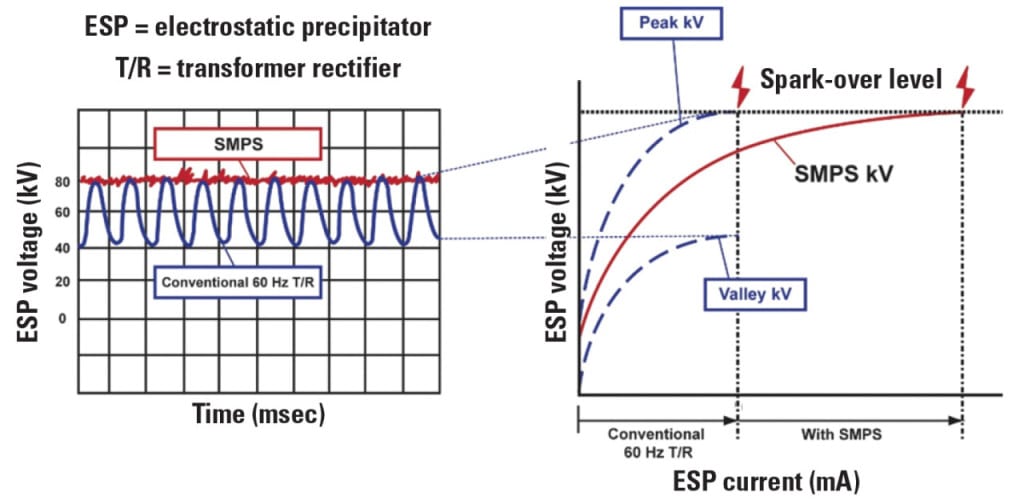
- Could the use of ESP specific corona power suggest that the quality of the power applied to the ESP may improve filterable emissions?
- Could use of pulsed energization, high-frequency power supplies, or three-phase power supplies have an impact on filterable emissions?
— K.S. Kumar (kskumar@babcock.com) is business development manager and J.A. Knapik (jaknapick) is technical consultant for the Babcock & Wilcox Power Generation Group Inc.