The world nuclear industry experienced few substantial changes in performance metrics for 2011—beyond Japan, that is. In the aftermath of Fukushima, the once–world leading Japanese nuclear industry fell to the bottom of the rankings, perhaps for good.
The big story for the world’s nuclear power industry in 2011 was the dramatic near-departure of Japan from the nuclear club. The consequences of the March 2011 earthquake and tsunami, which wrecked the Fukushima Daiichi nuclear plant and led to the radioactive contamination of large areas of northern Japan, are reflected in Japan’s precipitous drop in the worldwide rankings. Once one of the leading nations in total generation, Japan shut down the last of its operating reactors in May 2012. One reactor restarted at the beginning of July, but it is questionable whether the nation will ever regain the level of nuclear capacity it had before the disaster.
Total Electricity Generation, Capacity, and Fuel Share
The United States continued to hold its wide lead in number of reactors, installed capacity, and total generation (Table 1). France, likewise, is still by far the most reliant on nuclear power for its electricity.
 |
| Table 1. Total generation and capacity, by country. Sources: Nuclear Energy Institute (NEI), International Atomic Energy Agency (IAEA) |
In 2010, Japan’s fuel share from nuclear was 29.2%. The loss of nearly all its generating capacity, which was shut down after the earthquake and mostly not restarted, caused the nation’s share to fall to 18.1%.
The remainder of the rankings held steady over 2011.
Average Capacity Factor
With power demand rebounding as the world economy recovers from the 2008–09 crisis, most countries have shown slight to moderate gains in capacity factor over the past three years (Table 2). The big exception, again, is Japan, which was already near the bottom of the rankings but last year showed a precipitous drop from 67.5% to 46.3% in the aftermath of Fukushima.
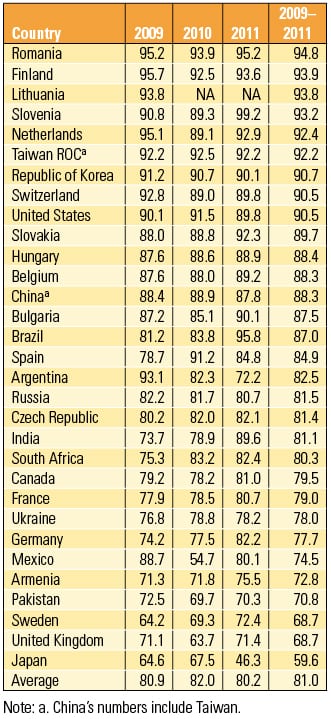 |
| Table 2. National capacity factors for the past three years and three-year average. Source: IAEA |
Most of the countries that had already been achieving better than 90% capacity held steady over 2011.
Availability by Country
The availability rankings continue to be dominated by European countries (Table 3). Worldwide, most availability ratings held steady or showed modest improvements as demand returned. Japan, as would be expected, showed a major drop in 2011.
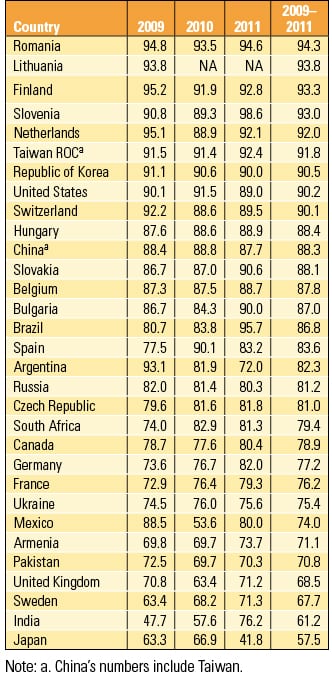 |
| Table 3. National availability factors for the past three years and three-year average. Source: IAEA |
U.S. Nuclear Power Uprates
Five U.S. reactors received power uprate approvals from the Nuclear Regulatory Commission (NRC) in 2011, with three of them being significant enhancements (Table 4). Units 1 and 2 at the Point Beach plant in Two Rivers, Wis., received approvals for 17% uprates, while Unit 2 at the Nine Mile Point plant in Scriba, N.Y., was approved for a 15% uprate.
 |
| Table 4. U.S. nuclear unit power uprates, approved and under review (2009 to present). Sources: NEI, NRC |
In June of this year, the NRC approved a 15% uprate for Units 3 and 4 at the Turkey Point plant in Homestead, Fla. A number of other uprates are pending for 2012, most of them fairly minor.
Applications for License Extensions
Five U.S. plants received renewed licenses from the NRC in 2011: Vermont Yankee in Vernon, Vt.; Prairie Island in Red Wing, Minn.; Kewaunee in Carlton, Wis.; Palo Verde in Tonopah, Ariz.; and Salem in Lower Alloways Creek Township, N.J. (Table 5).
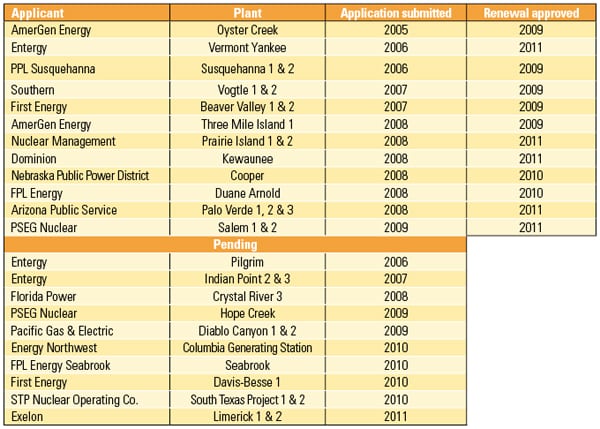 |
| Table 5. U.S. nuclear unit license renewals and applications (2009–2012). Source: NRC |
Ten other applications for renewal are pending, one of which was filed in 2011.
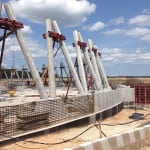
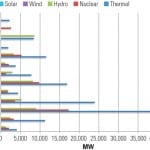
Nuclear Units Under Construction
China’s massive build-out of its power generation capacity is reflected in its wide lead in the number of nuclear plants under construction (Table 6). Twenty-six Chinese plants are reported to be in various stages of development. Though data for many of them are incomplete, the majority of planned units are believed to be Westinghouse AP1000 models, though China has been working to localize design and construction of nuclear reactors.
 |
| Table 6. Nuclear units under construction worldwide. Sources: NEI, IAEA |
Russia (with 10 reported projects) and India (with seven) are also forging ahead with ambitious nuclear plans, though not quite on the Chinese scale.
In the U.S., the NRC issued a construction and operating license (COL) for Vogtle Units 3 and 4 (also AP1000 designs), which are currently under construction in Georgia. The long-delayed Tennessee Valley Authority Watts Bar 2 project in Tennessee is currently projected to be completed in late 2015, though some sources expect further hold-ups. The Virgil C. Summer Nuclear Station in Fairfield County, S.C., was issued a COL by the NRC for its proposed Units 2 and 3 on March 30, but work has not yet begun.
Japan had two projects under way prior to Fukushima, but these are now on hold.
Average U.S. Production Costs
The costs of producing electricity at the nation’s nuclear plants, which had plateaued through much of the 2000s, continued the slight increase that began in 2009, largely driven by higher fuel costs (Figure 1). Total costs, however, remained below those for coal and gas.
 |
| 1. Still the leader. Despite slight increases in the cost of fuel, nuclear power remains the least expensive source of electricity per kilowatt-hour. Coal and natural gas data reflect total production cost. Nuclear data is shown in its components: fuel and operation and maintenance plus the total production cost. Data is for the period 1995 to 2011 in cents/kWh. Sources: NEI, Federal Energy Regulatory Commission |
Safety Stats Remain High
Worldwide, the substantial gains in nuclear industry safety since the 1990s held steady through the late 2000s.
In 2010, the most recent year for which full data are available from the World Association of Nuclear Operators (WANO), there was a slight uptick in the number of accidents per million man-hours from the all-time low achieved in 2009, but the 2010 rate was still the second-lowest ever achieved (Figure 2).
 |
| 2. Safety first. The worldwide nuclear industry continued its substantial progress toward improving worker safety over the past two decades. Source: WANO |
Overall levels of radiation exposure at pressurized water reactors plateaued in the 2000s, and the 2010 rate was consistent with levels achieved across the decade (Figure 3). For boiling water reactors, after a slight increase in exposure from 2007 to 2009, exposure levels fell to an all-time low of 91 man-rem per unit in 2010.
 |
| 3. Holding steady. Average radiation exposure levels have been largely unchanged since the mid-2000s. Source: WANO |
The 2011 numbers, when available, are likely to increase as a result of the Fukushima disaster, though to present an accurate picture, one would need to segregate the Japanese data.
— Thomas W. Overton, JD is POWER’s gas technology editor.