Infographic
-
 Hydrogen
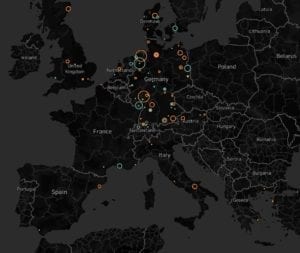
A Review of Global Power-to-Gas Projects To Date [INTERACTIVE]
According to experts from Technical University of Applied Sciences (OTH) in Regensburg, Germany, who recently reviewed the world’s existing power-to-gas (P2G) hydrogen and methane projects, about 143 P2G projects have operated since 1988 in 22 countries. Only 56 hydrogen and 38 methanation projects were active in 2019. While the existing fleet mostly comprises pilot or […]
-
 Hydrogen
THE BIG PICTURE: Hydrogen Power
Hydrogen is emerging as a formidable player in the energy transition, owing to its potential to decarbonize a range of sectors and its versatility. According to a June 2019–released report prepared for the G20 by the International Energy Agency (IEA) and the government of Japan, 76% of dedicated hydrogen produced today (around 70 metric tons) […]
-
 News
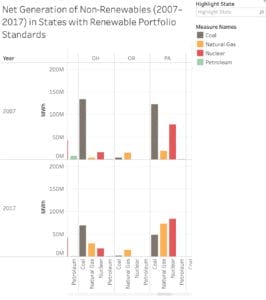
NewsHow Net Generation Has Changed in States with Renewable Portfolio Standards
As of August 2019, 29 U.S. states and the District of Columbia had renewable portfolio standards (RPSs), and eight others had non-binding renewable portfolio goals. Three states also had clean energy standards, which set targets for low-carbon non-renewables, like nuclear, and two had clean energy goals. Our monthly infographic in September 2019 shows how shares for each […]
Tagged in: -
 News
NewsTHE BIG PICTURE: Japan’s Nuclear Comeback
After the Great Tohoku Earthquake and tsunami, and ensuing crisis at the Fukushima Daiichi nuclear plant in March 2011, Japan issued stringent safety regulations and reviews that affected its entire 50-reactor fleet. It meant that as each Japanese nuclear reactor entered its scheduled maintenance and refueling outage, it could not returned to operation until restart […]
-
 News
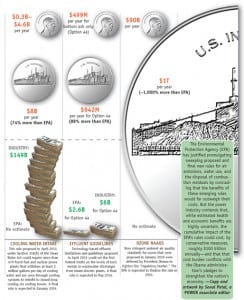
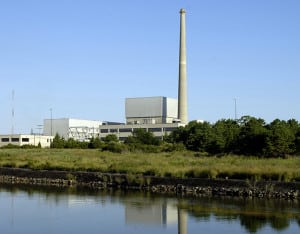
NewsHow Efficiently Have U.S. Nuclear Reactors Operated Over the Past Five Years? [INFOGRAPHICS]
According to the Nuclear Regulatory Commission (NRC), the nation’s 99 operating nuclear reactors operated at an average capacity factor of 88% in 2017—the same as in 2016—despite market forces that have rendered several units uneconomical. Figures for 2018 are expected in 2019 and may look different. Oyster Creek Nuclear Station, for example, was permanently closed […]
Tagged in: -
Infographics
THE BIG PICTURE: The Electric Vehicle Push
Because the widespread adoption of electric vehicles (EVs) could ramp up demand for electricity and slash transportation-related emissions of carbon dioxide and other pollutants, a growing group of stakeholders, including power companies and trade groups, strongly advocate for an accelerated EV rollout. By mid-2018, several countries with potentially large EV markets had set EV deployment targets, as well […]
Tagged in: -
 Legal & Regulatory
The Big Picture: Energy Transitions [INFOGRAPHIC]
An energy transition is underway across the world. Market upheaval, defining events, and recent policy changes have accelerated a shift away from coal toward renewables. Here is how this transformation played out for some of the world’s major economies over the past decade. Graphs show percent of each fuel source of total generation for that […]
-
 Legal & Regulatory
What States Told FERC About the DOE’s Grid Resiliency Rule [INFOGRAPHIC]
Comments on the Department of Energy’s (DOE’s) proposed grid resiliency rule from an assortment of state agencies, trade groups, environmental organizations, and organized market entities flooded the Federal Energy Regulatory Commission’s (FERC’s) docket before the tight three-week timeframe expired Oct. 23. The DOE’s “Grid Resiliency Pricing Rule” proposed on Sept. 29 directs FERC—an independent regulatory […]
-
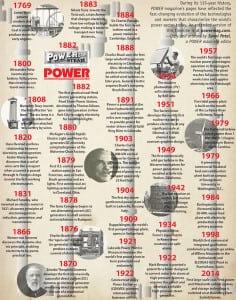 History
THE BIG PICTURE: The History of Power
During its 135-year history, POWER magazine’s pages have reflected the fast-changing evolution of the technologies and markets that characterize the world’s power sector today. —Copy and artwork by Sonal Patel, a POWER associate editor