Energy journalist Robert Bryce recently broke the news to mainstream American media. In a hard-hitting article published in The Wall Street Journal, he reported the findings of a Colorado energy research study, which earlier this year concluded that industrial wind technology in the regions of Colorado and Texas that it sampled neither reduced carbon dioxide (CO2) emissions in the production of electricity nor rolled back consumption of fossil fuels.
The raison d’être of the wind industry is to abate significant levels of the greenhouse gas emissions many feel are causing precipitous and adverse warming trends in Earth’s climate. Wind technology is also sold as an alternative source of power to coal-fired plants. Therefore, the American Wind Energy Association (AWEA), the trade organization for a constellation of limited liability wind companies, did not exactly welcome Bryce’s report with arms open. Instead, AWEA spokesman Michael Goggin penned a stern riposte, which alleged that Bryce and others skeptical about the efficacy of wind technology were “lobbyists” for the fossil fuel industry, spreading lies “to avoid losing market share to wind energy,” and compared Bryce and a range of people and organizations to the groups and pundits from the tobacco industry who once told Congress there was no causal link between cigarettes and cancer.
Goggin also produced evidence and testimonials in ABC fashion that he claimed validated “one of the universally recognized and uncontestable (italics added) benefits of wind energy: that (it) reduces the use of fossil fuels as well as the emissions and other environmental damage associated with producing and using these fuels.” He further boasted that there were “reams of government data and peer-reviewed studies” supporting the effectiveness of his employer’s technology.
Before addressing AWEA’s evidentiary offerings on behalf of wind’s carbon saving/ fossil fuel slaying potential—a bit of clarifying context.
First, Bryce is an energy realist who writes to effect more informed energy discourse in the hope of achieving better energy policy. In a recent televised forum at the Manhattan Institute, in which he introduced his recent book, Power Hungry, Bryce maintained that he is not a political or economic ideologue, is bored with political labeling, and that his ideas result from the way he was “mugged” by the laws of physics. He believes the most effective way to transition from high usage of coal, which now provides nearly half of the nation’s electricity and emits about a third of its CO2 emissions, requires a rapid increased deployment of natural gas generators as a bridge to a pervasive use of nuclear technology. And he recommends that environmentally questionable coal extraction techniques, such as mountaintop removal, be made illegal—the sooner, the better. Hardly the words of a fossil fuel lobbyist.
Second, contrary to the carefully cultivated perception that wind is David to coal’s Goliath, the record shows that people and corporations heavily involved with coal, natural gas, and oil are also involved with wind. In the 1990s, Enron’s Kenneth Lay, helped by then-Texas governor George W. Bush (today a leading wind booster), resurrected wind technology from the tomb to which steam power had consigned it. Giant energy corporations swaddled in coal and oil production, such as Florida Power & Light, General Electric, BP, AES, and Siemens, are all intensely invested in wind. They claim to be “diversifying their energy portfolios.” But do they also expect wind to reduce their fossil fuel market share?
Third, the National Academy of Science (NAS), in a report published in early 2007, concluded that, in the words of one of the researchers, “Wind power will thus not reduce carbon emissions; it will only slow the increase by a small amount.” [Note 1] Engineers and environmentalists in Britain, The Netherlands, Denmark, Canada, and Australia followed suit, publishing papers that are not only skeptical of wind’s CO2 offsetting abilities but also offering methodological accounting systems for scientifically calculating wind’s carbon impact on the electricity grid. None are beholden to the fossil fuel industry and none are paid lobbyists like Goggin.
Instead, all, including the NAS, have been rebuffed in their efforts to examine data on wind integration behavior at meaningful time intervals and amounts; instead, they’ve been told that such data is “proprietarily confidential” and can’t be released without the consent of the affected wind companies. So much for the transparency and accountability that were once the pillars of public policy, not to mention the scientific precept of refutability.
A few sources do publish wind performance information, notably the Ontario Independent Electricity System Operator (IESO) and, most thoroughly, the Bonneville Power Administration (BPA) in the Pacific Northwest. One can also get, with some digging, historic wind data on a plant-by-plant basis in New York and Pennsylvania. This information has clarified the peculiar nature of wind performance per se. But it is insufficient, for reasons explained later, to account for the way that “peculiar nature” affects the thermal performance of conventional generators throughout the grid system. And it is this phenomenon that intrigued the researchers from Colorado.
Fourth, it is true that the Independent Petroleum Association of the Mountain States (which is now the Western Energy Alliance) commissioned the Colorado report produced by Bentek Energy, an energy analytics firm based in Colorado. It is also true that Bentek was the first to get real-time performance data at sufficiently fine-grained time intervals, using an ingenious methodological approach that examined the heat rate penalties of (particularly) coal plants intimately involved with wind integration. More on this later.
What is astonishing, given the nearly universal aversion to sharing wind-related performance data, is that Bentek got permission to do this at all. Bentek demonstrated that, in the regions it studied, the peculiar nature of wind performance caused coal plants to perform more inefficiently, “often resulting in greater SO2, NOx, and CO2 emissions than would have occurred if less wind energy were generated and coal generation was not cycled.” The report concluded by recommending that Colorado and Texas begin replacing their older coal units with flexible natural gas–fired units that produce half the emissions of coal plants.
Ironically, this is precisely the recommendation that the National Renewable Energy Lab made in the Eastern Wind Integration and Transmission Study study Goggin cited. It is also the basis of AWEA’s own prescription for making wind variability work. On the one hand, Goggin rejects the Bentek study as a creature of the evil fossil fuel empire. But, without a hitch in his giddy-up, he then embraces language in that study that places fossil fuels in service to the white knights of wind. Whether this flop was noticed is unclear.
How Peculiar Is It?
What’s clear is that wind performance is very peculiar in terms of providing highly reliable and secure electricity at affordable cost. The following profile generally fits all industrial wind facilities, with their skyscraper-sized turbines placed five to a mile atop ridgelines for many miles along terrain or seabed. Because any wind “power” is a function of the cube of the wind speed along a narrow wind speed range (typically 9 mph to 33 mph), small changes in wind speed translate into large changes in the amount of wind energy convertible to electricity. Consequently, wind generation is relentlessly fluctuating, according to the whimsy of its power source, between zero production, which occurs 10% to 15% of the time, and its maximum possible performance, its rated capacity, which is achieved very rarely. Over the course of a year, a wind project, if sited in good wind territory, produces an average yield of about 25% to 30% of its rated capacity. About 60% of the time, it produces less. Whatever it does produce is constantly changing, moment-to-moment; no one can predict what it will produce at any future time. Wind’s performance history also shows that wind plants generally produce most at times of least demand—and least at times of peak demand. [Note 2]
Here’s an example of routine wind flux, culled at random from a BPA posting for a brief period on January 1, 2009 when BPA had 1,600 MW of installed wind. On this date, the actual wind generation was 443 MW in the first minute. Five minutes later it was 454; then it was 476; then 489; then 505, and so on. Three hours later it had fallen below 200 MW and continued downward. [Note 3] Occasionally, wind production involves very wide swings across nearly the whole range of its rated capacity, dropping or rising precipitously in less than an hour. [Note 4] Consider the impact of this flux if the installed wind capacity were 5,000 MW.
Wind volatility is somewhat like the fluctuations of demand, as people and industries turn their appliances off and on at random, but is much more intense and difficult to manage. In fact, grid engineers often refer to wind as negative demand. Because of its uncontrollable, largely unpredictable fidgety nature, it destabilizes the grid even more than demand fluctuations do. Moreover, as AWEA’s spokeswoman, Christine Real de Azua, stated a few years ago: "You really don’t count on wind energy as capacity. It is different from other technologies because it can’t be dispatched." The National Renewable Energy Lab last year said much the same: "Wind power cannot replace the need for many ‘capacity resources’" and that any capacity value for wind is "a bonus, but not a necessity." [Note 5] This has serious implications for efficient grid performance.
We expect electricity to be reliable, affordable, and secure, which is made difficult and more costly because supply and demand must match continuously. Unlike the water supply, large amounts of electricity can’t be stored easily, despite century-old quests, led by Edison, to invent battery storage systems. AWEA’s oft-trumpeted storage fix is pumped hydro, which generally can’t respond fast enough to accommodate rapid changes in wind output. (Other kinds of storage are frequently cited, but they are not practical, generally available, or economically feasible.)
Until recently, demand fluctuations were the primary reason for grid instability, because they are constantly breaking off their connection with supply, putting the two out of balance. However, demand flux is acceptable, even desirable (unless one is a grid manager), because having electricity whenever desired is so important to both economic productivity and quality of life. To preserve this freedom, electricity supply was made as stable, controllable, and reliable as possible so that precise amounts of supply could be dispatched—or retracted—to balance demand flux immediately. For example, if demand slackens by 5 MW, then exactly 5 MW of production is withdrawn from the grid, typically under automatic generation controls. Conversely, if there is 10 MW of increased demand, then exactly 10 MW of supply is ratcheted up. This kind of manageability is known as capacity value.
Conventional generators—coal, natural gas, nuclear, and hydro, which together account for 95% of the nation’s electricity power—must pass stringent tests of reliability and precision performance before they are deployed. All of their electricity generation is capable of being dispatched on command, since they have firm capacity—typically producing their rated capacities when asked to do so, maintaining a steady energy level throughout their operating time, except when they are called upon to ramp up or back in response to demand changes. These generators are then placed in an ensemble, each having a role to play, some providing for base load, others for peak and load balancing purposes. There is much behind-the-scenes tumult involved as many types of conventional generations converge at just the right time so that people and industries can be served without fuss or bother at the flip of a switch.
Unreliable wind volatility is the antithesis of supply stability; it has no capacity value. What most experts don’t properly account for, even those who understand the data, is the difference in the production delivery between conventional power units and wind, which is typically masked by snapshot reports of wind performance data that don’t reveal wind’s continuous skitter. The former provides their whole power (their rated capacity) at a controlled rate, unless asked to change by grid operators. Wind provides energy in fits and starts, always staggering its way around the grid, never controllable and rarely predictable except when shut down—in the process always entangled with supportive prosthetics—conventional generation—to make its production appear whole, steady, and precise. Beyond this, wind production is often inimical to demand requirements. For example, California’s independent system operator rarely sees more than 5% of wind’s installed capacity during the summer peak periods. It is this trait that is so “peculiar,” given the requirement for reliability and grid security.
Figure 1 illustrates the supportive prosthetics concept with the wind mirroring production required, typically by fossil fuel plants, to make wind output useful—that is, steady and reliable, as described above. As is evident, wind output is a much smaller part of a larger fuel mix but enmeshed in a yin yang mode where polar or seemingly contrary forces are existentially interconnected and interdependent. As in the old song lyric, “you can’t have one without the other.”
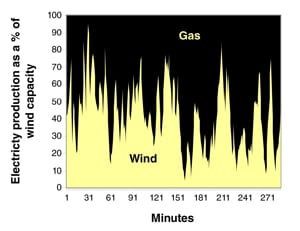
1. Illustration of the wind mirroring concept. Source: Jon Boone
Indeed, because wind’s average annual production rarely exceeds 30% of its installed capacity, electricity production from more than 70% of any wind project’s installed capacity must routinely come from conventional generation that performs inefficiently as it quickly ramps up and back to balance wind’s tempestuous ebb and flow. This is not "supporting" or back-up generation but rather proactive, reliable power that must be actively entangled with wind to make it work. Moreover, from the perspective of system reliability planning, wind requires conventional generators to cover nearly 100% of its installed capacity. (Even so, wind’s capacity value is zero in real time.) And all this is in addition to the requirement to balance demand fluctuations. What must infill the breach when wind production falls by 10 MW? What must be running when 1,000 MW of installed wind is producing nothing? In terms of energy—or even power—density, one cannot equate the production from any wind installation with the output of a conventional generator. One should only compare apples that produce capacity value—the ability to deliver precise increments of power—and have them withdrawn—on demand. Real de Azua was even more discerning than she realized. By AWEA’s own admission, wind provides no capacity and cannot be dispatched; it can only be a supernumerary supplement—but one that requires much supplementation.
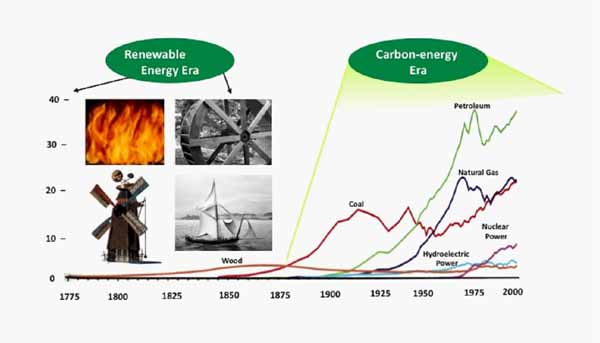
Not a New Energy Source
Wind is hardly new technology. It has been, along with water and horses, a mainstay "fuel" for a variety of machines hitched to the power needs of the human enterprise for thousands of years, always a tail-wagging-the-dog technology doing work on its own schedule. Wind provides sporadic energy to any grid, not modern power capacity. Its fuel is so energy diffuse that it cannot be converted to a continuous stream of steady power that people can control at their beck and call. This is why the Dutch stopped using windmills to grind grain and pump water hundreds of years ago, when steam engines were introduced. It’s why the vaunted Clipper ships of yore reside in museums. And why gliders don’t provide commercial transportation. Unlike modern machines, they may not work when or how we wish. As Williams S. Jevons wrote 150 years ago: "The first great requisite of motive power is that it shall be wholly at our command, to be exerted when, and where, and in what degree we desire. The wind, for instance, as a direct motive power, is wholly inapplicable to a system of machine labour." [Note 6]
The real issue for modern societies is power production, not energy of itself—and this is particularly true for electricity. Not just power production but rather, as energy expert Tom Tanton has said, the quality of the power production, taking into account the frequency, voltage, and harmonics that must be precisely congruent to achieve the reciprocal convergence essential for proactive modern power performance. [Note 7]
Can wind technology be harnessed, as AWEA maintains, to replace or supplement modern machines that fill their tanks with sufficiently energy dense fuels—coal, natural gas, nuclear, impounded water—to meet modern power quality expectations? If so, what are the consequences—for consumer costs and for any thermal activity involved with wind integration?
In truth, energy produced from wind is so erratic that it can’t be converted to modern power requirements—unless that energy is "fortified" with external energy to make it dense enough for modern power needs, as we will see. This "external energy" must also be accounted for.
The Bentek Study
The Bentek study showed that wind volatility in the sampled regions of Colorado and Texas caused more CO2 emissions than would have been the case with less wind and more-efficient coal plants.
Using mostly sub-hourly performance data, Bentek was able to “examine in detail how coal, gas and wind interact and the resulting emissions implications.” In general, the research team found that wind, typically much more active at night, a time of least demand, was more entangled with baseload coal plants, because most of the flexible, more costly gas plants were dispatched for use during the day, at times of higher demand.
As Bryce reported, the repeated cycling—ramping up and back—of coal plants, with their higher CO2 emissions, created heat rate penalties that produced a greater volume of CO2 emissions. The coal plants in a wind-balancing role were operating more inefficiently and thus required more fuel, much in the way an automobile does when driven in stop-and-go traffic. As noted earlier, Bentek then recommended that better results for carbon emissions offsets could be produced by introducing more responsive natural gas units on the system, in part replacing the coal plants with machines that burn 50% cleaner.
AWEA maintains this study must have been seriously flawed, because, as more wind was installed on the systems, Energy Information Administration (EIA) data showed that CO2 and other greenhouse gas emissions between 2007 and 2008 were reduced, and, within both states, coal and natural gas consumption fell as well. Goggin then quotes Frank Prager, who "pointed out the flaws . . . in the (Bentek) study and reconfirmed that wind . . . significantly reduced fossil fuel use and emissions." As vice president of environmental policy for the energy company, Prager is not a disinterested party. But it’s the evidence that’s important, not his testimonial.
Let’s look at the evidence more closely. The statistics that AWEA presents are accurate—as far they go. But there is more to the story. The wind trade association neglected to mention that both states increased their net imports of out-of-state electricity capacity by an amount that exceeded the reductions in in-state fossil fuel use. Figure 2 illustrates what AEWA claims to be the case.
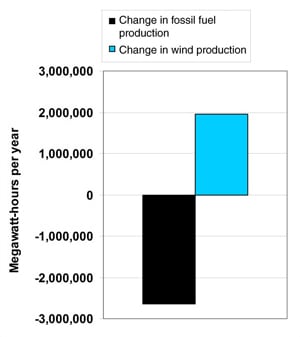
2. Isolating changes in fossil fuel and wind electricity production in Colorado for 2008. Source: U.S. Energy Information Administration. Independent Statistics and Analysis, Colorado Electricity Profile (2008 edition), Table 5.
However, to get a broader picture, it is necessary to look to other Department of Energy data, which includes interstate traffic in electricity. In 2008, Colorado had net imports of 3,604,000 MWh of electricity, and Figure 3 adds this factor to the Figure 2 representation.

3. Isolating changes in fossil fuel and wind electricity production and net imports in Colorado for 2008. Source: U.S. Energy Information Administration Independent Statistics and Analysis, Colorado Electricity Profile (2008 edition), Tables 5 and 10.
Consequently, there is another more plausible explanation for the reduction in fossil fuel use and greenhouse gas emissions in Colorado: increased net imports. Moreover, the imported electricity was most likely firm capacity from fossil fuel, nuclear, or hydro plants. If so, this completely circumvents the entire problem caused by increased wind volatility, which is a greater issue than steady operation at lower utilization. As an official from the Ontario IESO once said, "It is better to have a reduced capability that is available when needed than a greater capability that is only available when it is not needed." The import/export of firm capacity makes sense. But the import/export of wind makes sense only in the world of government-mandated good intentions—gone awry, essentially paying others to spread the dysfunction around while jamming up transmission lines with low-quality power.
If anything, this confirms the Bentek findings, reinforcing the view that increasing wind volatility imposes thermal inefficiencies throughout the system, ultimately saving no conventional fuels and, in the case Bentek studied, increasing CO2 emissions. AWEA has confused correlation with causation. Simply because there was a decrease in in-state fossil fuel use does not mean increased wind generation was responsible. As the Noble laureate Richard Feynman once said about scientific integrity: "if you’re doing an experiment, you should report everything that you think might make it invalid—not only what you think is right about it: other causes that could possibly explain your results; and things you thought of that you’ve eliminated by some other experiment, and how they worked—to make sure the other fellow can tell they have been eliminated." [Note 8]
The same situation occurred in the Texas study area. Increased net imports from other states also more than compensated for reductions over this time period in in-state fossil fuel use. Moreover, EIA state-by-state data show that, from 2005 through 2007, CO2 emissions in Colorado had increased steadily, despite increasing numbers of wind projects. For Colorado, CO2 emissions were 41.2 million metric tons in 2005; by 2008, there were 41.5 million metric tons, down slightly from 2007 levels of 43.4. In Texas, the situation over the entire decade shows ups and downs along a fairly steady state, varying only by 9%. In 2000, emissions were 264.4 million metric tons—a decade high. By 2005, emissions were 260.7; by 2008, they had declined to 252.1, down from the previous year’s total of 257.1, for reasons, as in Colorado, that can be accounted for by an increase in net imports, among other reasons. (For those interested in whether or not wind reduces Danish CO2, check out increased imports of hydro [not just exported wind to Scandinavia] and the higher efficiency of newly installed combined heat and power plants.)
A review of the history of changes in fossil fuel–generated electricity and net imports provides further support for the thesis that imports are the source of reduced fossil fuel plant use. Since 2000, and before the introduction of much wind activity, there are years that show similar change patterns. One year shows substantial growth in in-state generation and much reduced imports, and other years show small amounts of change in in-state generation and imports, representing a more-or-less steady-state condition. Further motivation for changes on a year-to-year basis may reflect wholesale pricing conditions at the time. Nationally, grid managers at the beginning of the decade anticipated demand increases of more than 2% annually and called for new power plants to meet it. When demand actually decreased because of the economic crash in 2007, any new plant that came on line in that year, replacing an older unit that was to be retired in 2008, could have been responsible for an increase in MW for 2007—and then a sudden reduction in 2008. Alternatively, some of these plants now supply more than is needed because of reduced demand and are dispatched less often than originally intended.
Despite the plausibility of the net import case for the small reductions in fossil fuel use and greenhouse gas emissions in 2008, much uncertainty nonetheless remains about what is actually happening. The variables involved are highly complex, and one should examine them both individually and as they interact. Although, because so many things are possible, it is possible that wind may have played a role, that idea must compete with more probable events. Figure 4 rather dramatically illustrates there is more at play than changes in fossil fuel production affecting CO2 emissions levels, because the two phenomena don’t appear well correlated.
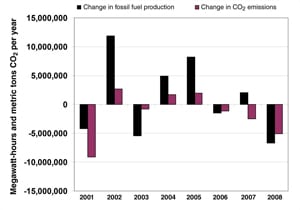
4. Annual changes in fossil fuel plant production and CO2 emissions for Texas. Source: U.S. Energy Information Administration. Independent Statistics and Analysis, Texas Electricity Profile (2008 edition), Tables 5 and 7.
AWEA’s contention that there exists "overwhelming evidence," "indisputable data," and "uncontestable benefits" to support its belief that wind is a potent offsetter of emissions is, at best, disingenuous and probably spurious. It is definitely not derived from scientifically vetted evidence. Whatever claims are made for wind should not ignore a grid’s requirement for capacity, in most cases in the form of highly inefficient fossil fuel plant operation used to balance unreliable and erratic wind production.
This is particularly true in any discussion about AWEA’s claim that wind has "nearly zero marginal operating costs" compared to conventional generation. It should. Considering that its capital plant is almost wholly subsidized by public dollars (note the other elephant in Bryce’s article was the high per energy unit subsidy for wind), one should wonder why wind charges a dime for its product (on some grids, it must). Even so, comparing the costs of capacity-less wind to the costs—at any level of consideration—of firm capacity plants seems incredibly silly. It is only appropriate that a third-string minor league first baseman, who made the team because his father contributed to the stadium fund, costs less than the major league’s Babe Ruth. And let’s agree that the nearly zero operational marginal cost of a soapbox derby vehicle, which at least has some manageable capacity, is incomparably less than a Boeing 747.
Portions of this article have appeared on MasterResource and the Institute for Energy Research.
—Jon Boone retired after a 30-year career at the University of Maryland, College Park, but he is a lifelong environmentalist and co-founder of the North American Bluebird Society. Today, Boone’s interests are painting and seeking "informed, effective public policy and an environmentalism that eschews wishful thinking because it is aware of the unintended adverse consequences flowing from uninformed decisions."
See Also
Part II of our two-part series "Overblown: Windpower on the Firing Line" looks at how the relentless variation of wind generation generally requires compensatory fossil-fueled generation, and that inefficient cycling of existing fossil-fueled plants increases carbon emissions that offset in many cases any initial savings by wind energy. Clever engineering schemes can mask the problem, but the data show that wind generation has and will continue to reduce carbon by negligible amounts, but at great expense.
Notes
1. A highlight of the report, from its press release, as shared by Rick Webb, a member of the committee that prepared the report and a senior scientist with the Department of Environmental Sciences, University of Virginia, in an email, May 10, 2007.
2. This is evident throughout the world. See the links to wind performance at the Ontario IESO and BPA. See also the 2004 and 2005 Wind Reports for Germany done by E.ON Netz. See also an independent chart of wind performance in Ontario and an example of capacity factor performance. In the BPA in 2008, wind’s capacity factor was 14%. Jim Oswald’s PowerPoint presentation, "UK Windfarm Performance 2005, Based on Ofgem: ROC Data," is a good summary of wind performance in Britain.
Note the following graphs, the first provided by Eric Rosenbloom, a science editor and writer, showing the performance of New York’s largest wind plant, Maple Ridge, located in Tug Hill, with an installed capacity of 231MW. The second, from the BPA, shows the percentage (frequency) of wind’s rated capacity distributed throughout a season (Figure a).

a. Maple Ridge Wind Plant power production from July to September 2006. Source: Eric Rosenbloom.
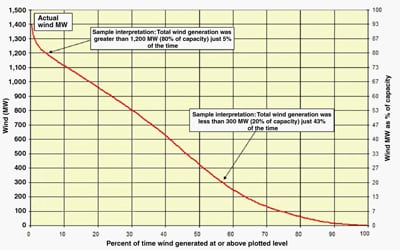
b. Cumulative frequency distribution of the total wind generation in BPA balancing authority area: January 08 to September 2008. Source BPA
3. See the BPA graph (Figure b, above), "Total Load & Wind Generation in the BPA Control Area." Beginning 1/09, at 5-minute increments, updated monthly. Total installed wind capacity during this period was 1,430 MW. Source: 5-min. data via SCADA point 73687.
4. As wind surged in the BPA, with an installed capacity of 1,600 MW, from 150 MW at 9:50 reaching1,350 MW 90 minutes later on December 29, 2008. See also, "Can Wind Be Too Much of a Good Thing?"
5. In Platts Power Markets Week, by Yakout Mansour, president & CEO of CAIESO, August 21, 2006. Whieldon, Esther, "CAL-ISO Offers Sobering Wind Assessment: It’s Growing but Can’t Be Relied On as Capacity." See also:
DOE’s 20% wind power by 2030.
6. William Stanley Jevons, The Coal Question (1865), p. 122.
7. Tom Tanton, personal email dated September 1, 2010.
8. Adapted from his commencement address at California Institute of Technology in 1974.