Managing the coal-combustion process requires rapid and accurate measurements of key combustion reactants and products. For many processes, the focus is on increasing efficiency by controlling the chemistry and monitoring regulated emissions such as NOx. On utility boilers, the state of the art in NOx removal is using a selective catalytic reduction (SCR) system.
A critical element in monitoring SCR operation is the performance of the catalytic bed. Diagnosing potential problems on an SCR may be facilitated by reliably monitoring NOx concentrations at the inlet as well as the outlet to the SCR unit. In addition to obtaining temporal data on NOx concentrations, having spatially resolved measurements enables the location of degraded performance within the catalytic bed.
In the past, inlet and outlet NOx was measured using conventional extractive continuous emissions monitoring systems (CEMS). Such systems are used for reporting regulated emissions, but they are expensive to purchase. Extractive, so-called micro-CEMS cost less than the regulatory CEMS; however, both types require frequent maintenance. Because of these cost issues, operators are reluctant to install multiple instruments to gain spatially resolved monitoring capability.
HORIBA, in collaboration with EPRI and Kurz Technical Services, has developed a low-cost, low-maintenance, in situ instrument for monitoring NOx concentrations: the INM-700. The benefits of its low purchase price and low operating and maintenance cost should be of great interest to operators and maintainers of power boilers. This article describes a series of successful tests conducted at a commercial coal-fired power plant.
NOx Removal Basics
NOx emissions result from three separate thermo-chemical reactions:
- Thermal formation of NOx, the high-temperature oxidation of N2 present in combustion air. The formation is a function of temperature and residence time.
- The combustion of certain liquid and solid fuels containing nitrogen.
- The prompt formation of NOx through the rapid reaction of N2 with free radicals such as C, CH, and CH2.
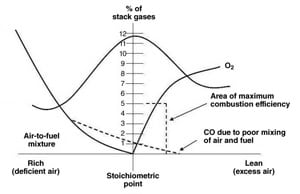
Regardless of the NOx formation mechanism or the technology solution selected to remove NOx, all rely on NOx monitoring from the CEMS at the stack or in the duct leading to the stack. Such measurements are distant from the combustion process and are frequently a composite reading of multiple units feeding into a single stack.
Far better would be the ability to use an inexpensive, reliable, and accurate in situ unit analyzer. Such an analyzer would also benefit SCR operations.
More efficient use of SCR systems may be enabled using NOx monitors at the inlet and outlet to the catalytic beds. The SCR process controls emissions of nitrogen oxides through catalytic reduction of NOx by reaction with NH3 to produce N2 and H2O. In general, the SCR consists of a reactor chamber with a catalyst bed and an ammonia-handling and injection system. The ammonia is injected into the flue gas upstream of the catalyst. In commercial operations, SCR systems provide reductions in NOx emissions on the order of 90%.
Optimum operation of an SCR depends on the control system’s reliable monitoring of NOx concentration in the flue gas at the inlet and outlet of the SCR catalytic reactor. Optimization balances the requirements for a high degree of NOx emission reductions using a minimum amount of ammonia. An excess of ammonia contributes to the costly phenomenon called ammonia slip. Current practice uses micro CEMS to monitor at the inlet and outlet of the SCR, but SCR systems may be better optimized using direct inlet and/or outlet NOx data provided by an in situ instrument.
In the remainder of this article we present a general description of the zirconium oxide sensor, its performance specifications, how it was integrated with a coal-fired power plant, test measurement results, and analysis.
Theory of Operation
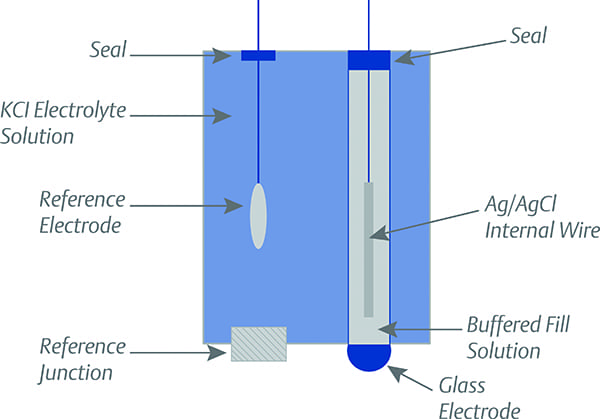
At the heart of the instrument is a sensor technology based on zirconium oxide (ZrO2), an adaptation of an analogous measurement strategy used for automotive applications. In general, the ZrO2 for sensor applications is typically processed as a zirconia ceramic. The ceramic can have various transition metals added to enhance certain characteristics. One property that enables ceramic ZrO2 to be used as a sensor is its porosity to oxygen ions and other molecules at temperatures above 650C (1,202F). An O2 sensor takes advantage of this property.
The sensor is basically an electrochemical cell constructed by applying a thin film of porous platinum (Pt) to two opposing surfaces of a ZrO2 ceramic. This element divides the reference side of the cell from the sample side. The Pt films serve as the electrodes, and the heated ZrO2 serves as the electrolyte. Differences in the partial pressure of O2 from one side of the electrochemical cell to the other create an electromotive force. Oxygen ions (O2-) are able to migrate across the ZrO2 electrolyte in a direction to restore the potential equilibrium. As long as there is a difference in the partial pressures between the reference and sample sides of the electrochemical cell, ions will migrate and current will flow (Figure 1). The imbalance yields an accurate measurement of the partial pressure difference between the reference and sample. Knowledge of the partial pressure within the reference gas then allows calculation of the partial pressure in the sample gas.
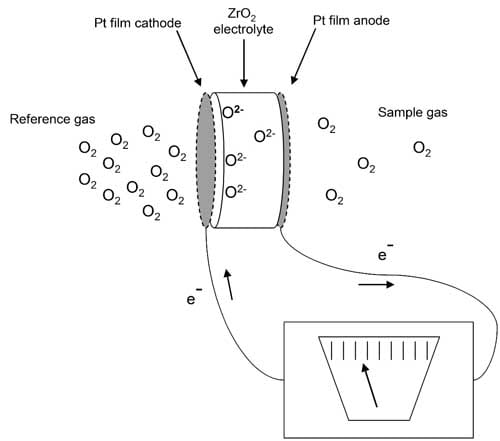
1. Sensors based on ZrO2 used in an electrochemical cell configuration have reliably been used to measure O2 concentrations in gases for decades. Source: www.bosch.com
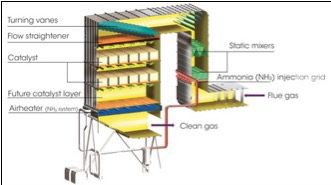
This technology has been taken a step further by incorporating a novel zirconium oxide sensor into an analyzer that is capable of simultaneously measuring O2 and NOx. This sensing approach was first developed for automotive applications in a direct-installation gas analyzer for real-time, on-board vehicle emissions. It is used to measures NOx and air-fuel ratios in engine exhausts. The sensor has now been adapted for industrial applications such as power plants.
The underlying idea behind the sensor used in the instrument is schematically shown in Figure 2. The sensor comprises an internal heater and two internal chambers. The chambers house three pairs of electrodes: one electrode pair in the first chamber and two electrode pairs in the second chamber.
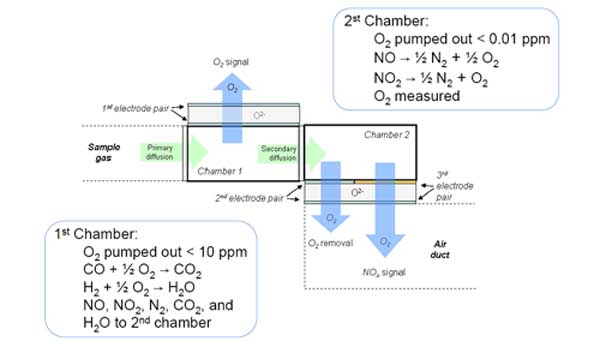
2. The novel sensor accurately measures NOx and O2 for monitoring and control applications. Source: HORIBA Instruments
Sample gas enters the first chamber through a primary diffusion element. Within the first chamber, a Pt electrode pair is used as an electrochemical pump to reduce oxygen levels in the sampled gas to below 10 ppm and yield a measurement of the oxygen concentration in the sampled gas. The oxygen-depleted sample gas then diffuses into the second chamber. Within the second chamber, oxygen levels are further lowered to less than 0.01 ppm by a second oxygen-pumping Pt electrode pair. This also provides a feedback signal of the oxygen levels to the electrochemical pump in the first chamber to effect consistent pumping conditions with respect to the changing ambient and reference oxygen levels. The third electrode pair, made of rhodium (Rh), is used to infer the NOx concentration from the oxygen signal. Table 1 illustrates the performance of this proprietary technology.

Table 1. The zirconium oxide sensor’s performance specifications. Source: HORIBA Instruments
The benefits of this analyzer are several:
- A nonextractive point measurement analyzer has no limitations on probe length, and the sensor may be positioned at the probe tip; thus, the measurement zone may be located with high precision and close to the process needing to be monitored or controlled.
- The ceramic filters allow rapid diffusion to conduct time-sensitive measurement of the sample.
- The underlying sensing technology based on zirconium oxide is well-tested, highly reliable, and inexpensive.
- Increasing the measurement capacity to measure two species simultaneously greatly reduces the analysis costs by reducing the initial purchase price, reducing installation costs, and reducing maintenance.
- Because the costs to own and operate are low and the sensor can be precisely positioned, multiple analyzers can map out discrete regions of the SCR system’s catalyst bed to locate underperforming areas where the catalyst may be poisoned.
- The analyzer has a unique refresh feature that contributes to a long operating lifetime.
- By periodically applying a low AC voltage to the electrode pairs, and synchronizing this with a pulse of purge air, contamination caused by deposits can be removed.
Facility Integration
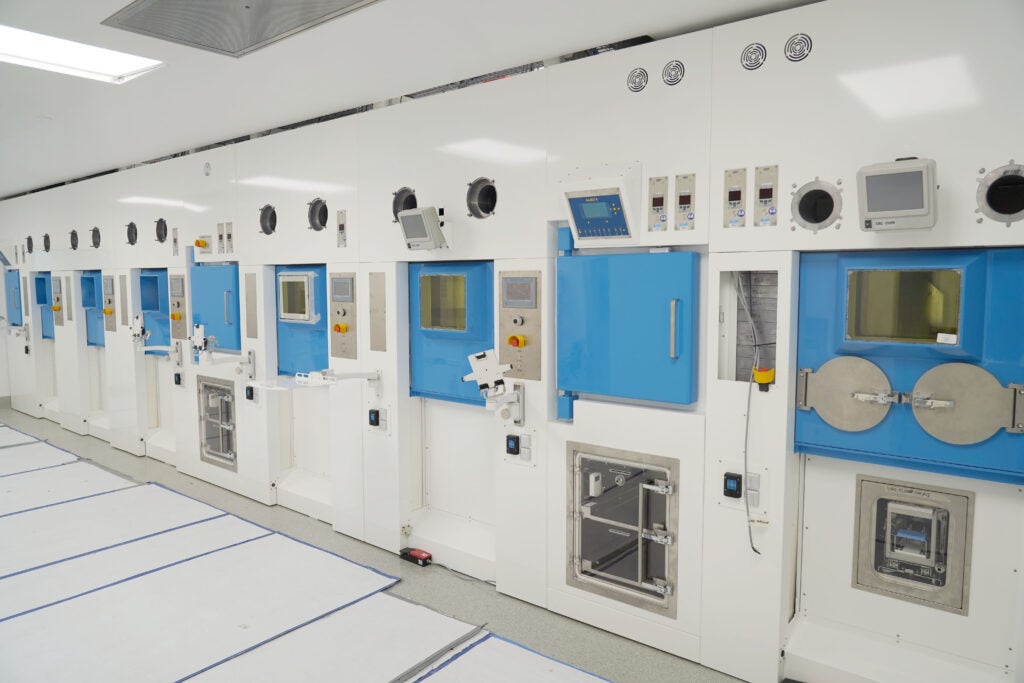
Tests were conducted as part of an EPRI-sponsored evaluation study on the coal-fired Unit 9 of TVA’s Kingston Fossil Plant in Harriman, Tenn. Unit 9 has a 200-MW, tangentially fired split furnace. The instrument was installed on the reheat furnace at the economizer outlets, where temperatures can reach 400C (750F) and NOx levels have reached equilibrium. This location is ideal for an in situ NOx analyzer because it is relatively close to the SCR inlet for control purposes, and it is remote from the effects of slag condensation on the probe.
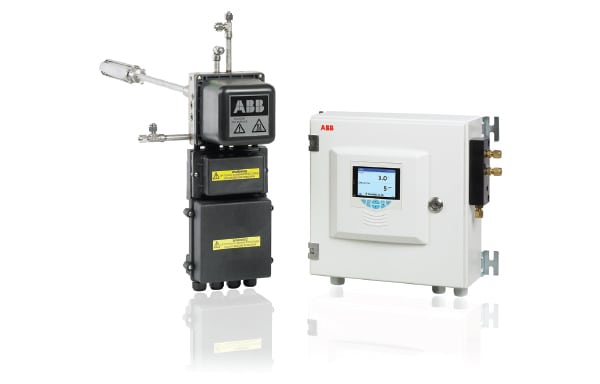
Figure 3 illustrates the mounting for the probe and the NEMA 4 enclosed control panel. The probe and control panel were separated by approximately 15 feet. Installation conditions for the probe and controller and interface parameters are shown in Table 2.
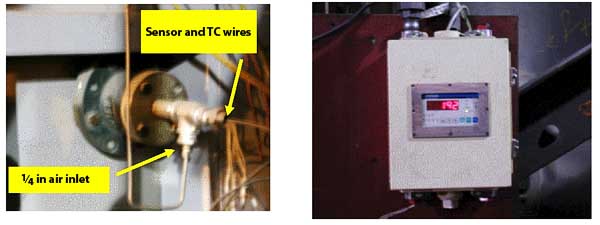
3. The simplicity of the instrument contributes to low installation and maintenance costs. Courtesy: HORIBA Instruments
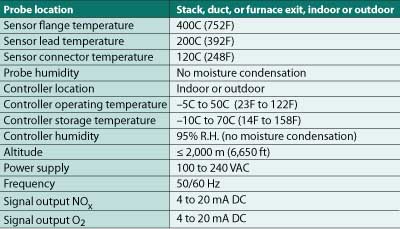
Table 2. Installation conditions and interface parameters. Source: HORIBA Instruments
Field Results
Initial characterization work on the zirconium oxide sensor was carried out by the development team. The zirconium oxide sensor was examined to determine how its performance correlated to a chemiluminescence analyzer over a 100- to 500-ppm range. Testing demonstrated an excellent linear correlation test R2 of over 99%.
A prototype of the analyzer for long-term testing was commissioned on Unit 9 at the Kingston plant in March 2007 and has been operating almost continuously as of the writing of this article. Earlier sensor characterization tests on site uncovered two problems: signal dropout and signal drift.
Prior to commissioning the prototype, instances of signal dropout had occurred. In Figure 4, the signal dropout is seen to begin at approximately 24:09 on August 4. The problem of signal drift developed later. An example of signal drift is shown in Figure 5 and begins at approximately 08:00 on January 24. Both of these problems were eliminated by applying a sensor refresh cycle synchronized with purge air. For Unit 9, the refresh is applied once every six hours for approximately 10 minutes. A series of refresh cycles are shown in Figure 6 for Unit 9. The first refresh cycle is shown to begin at approximately 17:34 on January 3. The optimal cycle is dependent on the application.
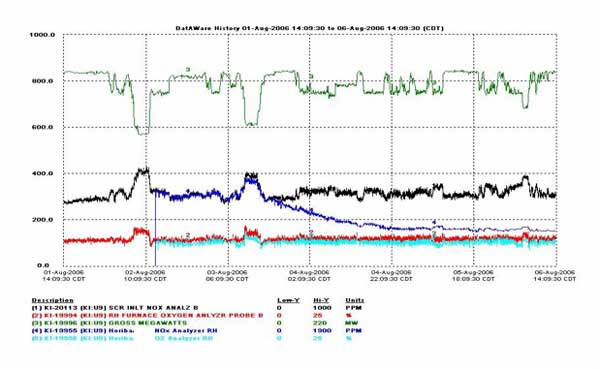
4. Data trace shows signal dropout. Early sensor characterizations in the field uncovered occasional signal dropouts, which led to development of the sensor refresh feature—a reliable solution. Data traces show the plant output in MW, NOx measurements from the instrument and the plant’s chemiluminescence analyzer in ppm, and O2 measurements from the instrument and the plant’s O2 analyzer in percent. Data are presented as a function of time. Source: HORIBA Instruments
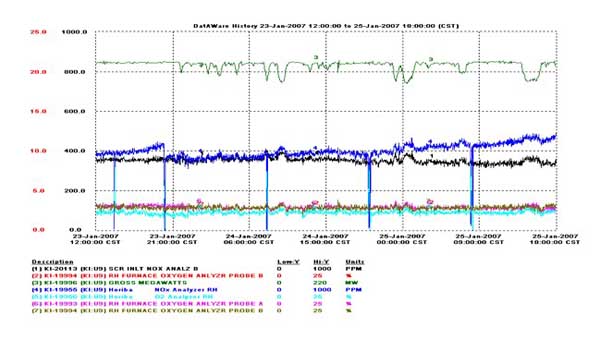
5. Later sensor characterizations showed signal drift. Signal drift issues were overcome with adjustment of the sensor refresh cycles synchronized with applications of purge air. Source: HORIBA Instruments
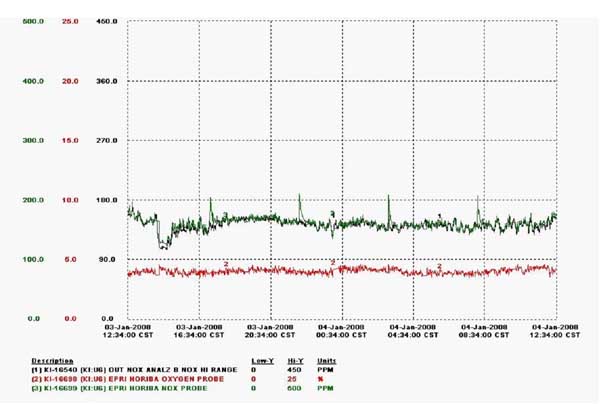
6. Data were taken from an analyzer operating on Unit 6. For Unit 9, application of a sensor refresh every 6 hours eliminated signal dropout and drift. Source: HORIBA Instruments
The instrument has been in operation since March 2007, and long-term testing continues on Unit 9. Figure 7 shows a trace after the 50th day of continuous operation. The instrument demonstrated very good tracking to the plant’s analyzers and showed good response to plant operating conditions.
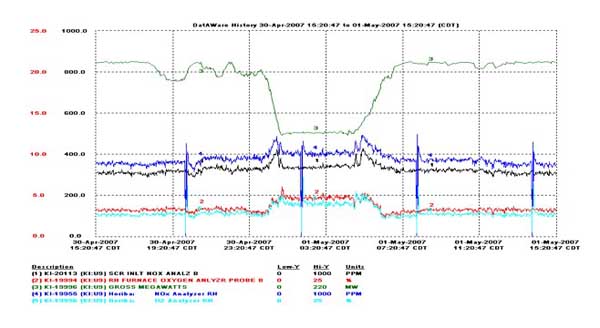
7. Long-term tests demonstrate good tracking, response, and stability. Data trace shows performance at the 50th day of operation. Source: HORIBA Instruments
The ~50 ppm bias observed between the instrument and plant NOx analyzers indicates a calibration is required. The offset in time is expected between the in situ instrument and the extractive plant NOx analyzers.
Acknowledgments
The authors wish to thank many individuals, including Amy Hulen, Rob Frank, Chad Starnes, Dave Horstman, Dick Bates, Dave Vojtko, Satoshi Inoue, Shigeyuki Hokamura, and Hiroshi Mizutani.
—Peter A. DeBarber, PhD (peter.debarber@horiba.com) is director, Process & Environmental Segment, for HORIBA Instruments Inc. Donna L. Dearmon (dldearmon@kurztech.com) is a project engineer for Kurz Technical Systems Inc.