Over the past decade, there has been a significant change in the U.S. system of power generation in the lower 48 states. The major factors that resulted in these changes were the discovery of new natural gas resources, increased use of renewable sources of power generation, and changes in environmental regulations. Although these factors have resulted in a significant decline in electric generation from coal, the fuel remains an important segment of the U.S. power mix.
The installed capacity and capacity factors for the U.S. coal fleet have been decreasing in recent years. Much of the decline is due to economic forces, resulting from the low price of natural gas and higher costs of compliance with various environmental regulations for coal generators, both of which give gas a competitive advantage over coal when used for power generation.
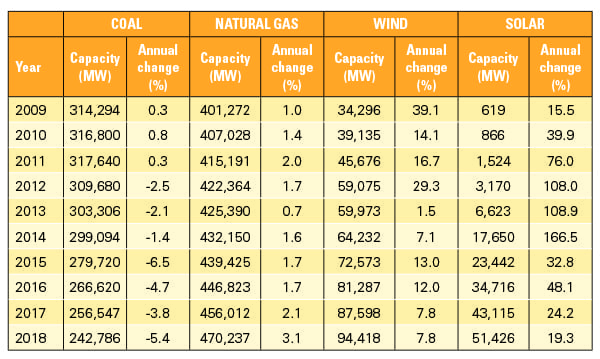
Table 1 shows the decrease in installed capacity of coal units and the increase in capacity of gas-fired units and renewables. The renewables discussed in this article are mainly wind and solar generation. Hydro is a strategic element in the U.S.’s generation program, but there have been few changes in recent years in the country’s installed hydro capacity, which is about 80 GW. Nuclear power remains a significant part of the U.S. power mix, although several nuclear plants have been decommissioned in the past half dozen years, while only one new reactor has come online since the mid-1990s. The U.S.’s installed nuclear capacity remains about 100 GW.
 |
|
Table 1. Installed net summer generating capacity in the U.S. by generation source. Source: U.S. Energy Information Administration (EIA) |
The 6.5% decrease in coal-fired capacity in 2015 was related to the compliance date for the Mercury and Air Toxics Standards (MATS) and the decrease in the price of natural gas. During the past 10 years, the installed coal capacity has decreased 71.5 GW while the natural gas and renewable installed capacities have increased 69.0 GW and 110.9 GW, respectively. Table 1 also shows that gas and renewable projects have increased capacity more than the decrease in coal-fired capacity by 108.4 GW.
The U.S. power industry has increased capacity while demand for electricity has been stagnant. However, there are areas where additional capacity is required due to transmission or pipeline limitations. The U.S. Energy Information Administration (EIA) reported that in 2009 the electric utility industry generated 4,119 TWh. In 2018, it generated 4,174 TWh. The average annual generation during the 10-year period was 4,131 TWh, with only one year deviating more than about 2% from the average.
Capacity Factors Largely Affected by Gas Prices
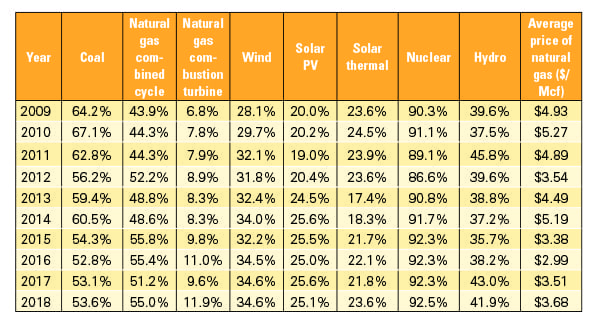
Table 2 presents the annual capacity factors for various sources of U.S. power generation. Capacity factor is the ratio of the electrical energy produced by a generating unit over a period of time considered to the electrical energy that could have been produced at continuous full-power operation during the same period. With the price of natural gas for power generation at historically low levels for several years, coal plants have experienced a decrease in capacity factors, resulting in increased cycling, while combined cycle and simple cycle natural gas generation has increased. The nuclear power fleet has maintained a fairly constant capacity factor of about 91% during this period. Table 2 also presents the national average annual price of natural gas used in power generation. There is a direct correlation between the decrease in installed capacity and capacity factors for coal-fired units, and the price of natural gas.
 |
|
Table 2. Average capacity factors for utility-scale generators in the U.S. and price of natural gas for power consumption in dollars per thousand cubic feet ($/Mcf). Source: EIA |
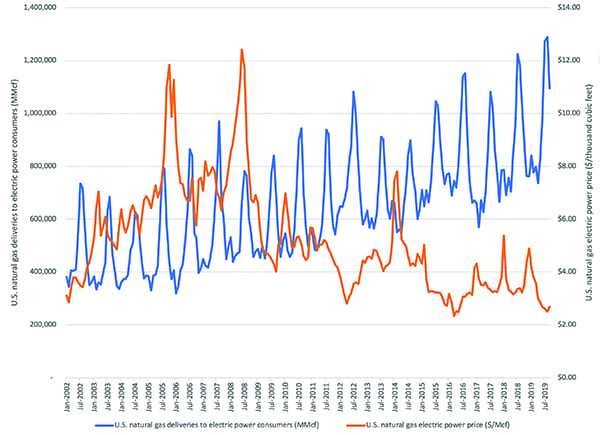
Figure 1 presents an analysis of the amount of natural gas used in power generation versus the cost of natural gas to the power industry. There was a trend starting in 2005 that demonstrates the increased use of gas for power generation as the price decreased. The graph also shows the spikes in gas prices in January and February between 2013 and 2018. The power industry must compete for the use of gas with the priority for home heating during these months. Most power generation units that use natural gas have interruptible contracts that require them to curtail gas usage under certain conditions. The peaks in this figure for gas usage and price are all weather-related.
 |
|
1. Comparison of U.S. natural gas deliveries to electric power consumers in million cubic feet (MMcf) versus the price of natural gas for electric power generators in dollars per thousand cubic feet ($/Mcf). Note: 1 cubic foot = 1,036 Btu (based on the U.S. average for natural gas delivered to consumers in 2018). Source: EIA |
Ambient and Daily Impacts on Generation
Reviewing annual data does not provide a clear view of the significance that coal-fired units and other technologies have in the daily generation profile. If Jan. 30, 2019, the coldest day of the year, and July 19, 2019, the hottest day of the year, are analyzed, a better view of the significance that coal-fired generation and the generation mix have on the power generation profile in the lower 48 states is obtained. In January 2019, there was 834,116 MMcf (million cubic feet) of natural gas used for power generation, while in July 2019, one of the highest monthly consumptions of natural gas for power generation occurred (1,267,083 MMcf), which coincided with one of the lowest average prices for gas. A comparison of natural gas usage and pricing is presented in Table 3.
 |
|
Table 3. This table shows the total consumption in million cubic feet (MMcf) and average price of natural gas for electric power generation and residential use in January and July 2019. Source: EIA |
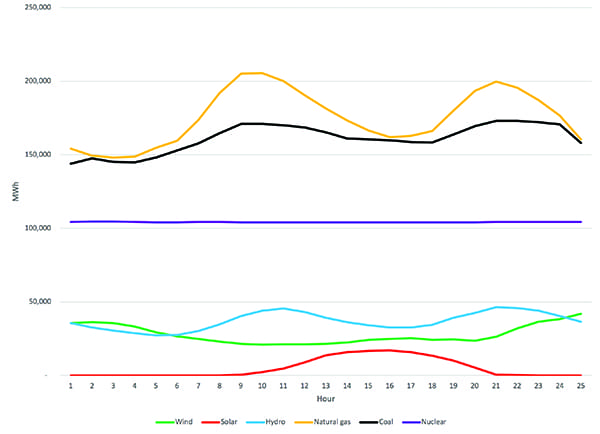
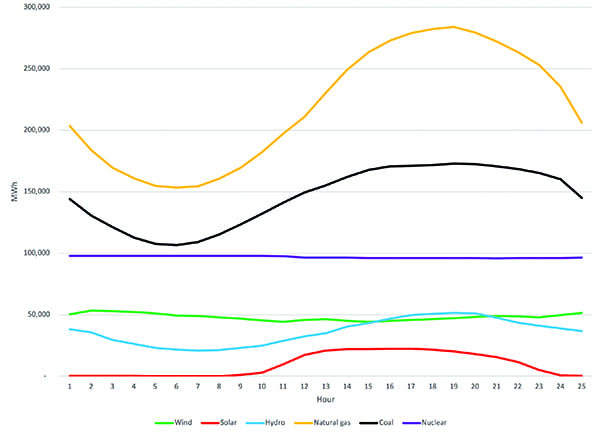
As can be seen in Figure 2, coal generation played a significant role in the generation mix on Jan. 30, 2019. At times, coal generation was virtually equal to gas generation. Figure 2 also shows that on this particular winter day, solar had a minimal impact on the total generation and wind generation peaked at about midnight while total load was decreasing. Hydro generation was able to optimize output to match peak demands. Nuclear generation was baseloaded and provided almost 20% of the total generation.
 |
|
2. U.S. electric generation energy source profile on Jan. 30, 2019. There are generally two demand peaks observed in the profile during winter days. Source: EIA |
The capacity factor for coal units on Jan. 30, 2019, was 68.4% (above the annual average) and the capacity factor for natural gas was 38.5% (below the annual average). If gas was to completely replace coal on that particular winter day, an additional 3,871 GWh of gas generation would have been required, if we assume that renewable capacity was optimized. An analysis would have to be made to determine if there was enough gas available without reducing residential and commercial usage. For the lower 48 states, solar only provided 1% of the generation, while wind provided 5.3% on the coldest day of the year.
Figure 3 presents the generation profile for July 19, 2019—the hottest day of the year. The load profile and the cost of fuels are significantly different from Jan. 30. On Jan. 30, the total daily system load was 12,619 GWh with a peak load of 568 GWh, while on July 19, the total system load was 13,747 GWh with a peak of 692 GWh. In July, there was minimal natural gas needed for residential use, therefore abundant gas was available for power generation at reduced cost.
 |
|
3. U.S. electric generation energy source profile on July 19, 2019. Summer days generally have a single, larger demand peak each day. Source: EIA |
In January 2019, the monthly average price of natural gas for power generation was $4.16/Mcf (thousand cubic feet). The average price in July 2019 was $2.62/Mcf. The higher price of natural gas in January had a direct impact on the increase in coal generation. January 2019 had the highest total monthly consumption of natural gas dating back to 2001. However, natural gas for power generation was only slightly elevated.
There was more wind generation on July 19 than on Jan. 30, and gas was used to pick up most of the capacity. Again, hydro was able to optimize its generation with coal providing peaking and baseload supplies.
On July 19, the coal-fired fleet had a capacity factor of 61.9%, while the natural gas-fired fleet operated with a capacity factor of 48.0%. The increased coal-fired capacity factor demonstrates its significance during high-demand periods.
Longer-Term Snapshots
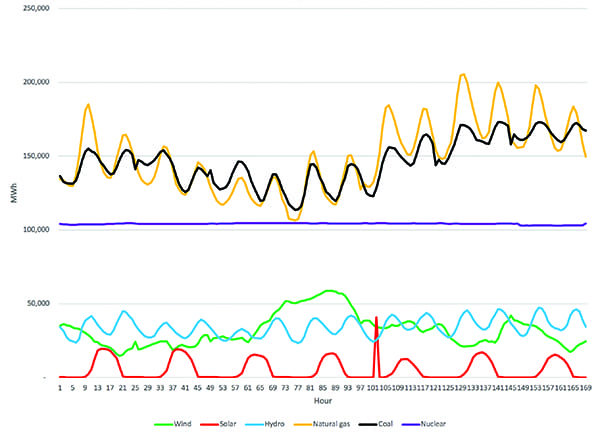
To get a different perspective on the U.S. generation profile, consider a week’s worth of data during a high-temperature period. The data for the period of Aug. 14–20, 2019, is presented in Figure 4. During this period, significant load swings for both gas and coal-fired generation are shown. Nuclear generation was baseloaded as usual. Solar energy peaked during periods of high demand. Hydro operators were swinging load to match demand and to optimize revenue, while wind generation peaked at low-demand times. There was a single peak demand period every day during this period.
 |
|
4. U.S. electric generation energy source profile for the seven-day period of Aug. 14–20, 2019. Source: EIA |
The large swings in generation for the gas and coal-fired fleets have a detrimental impact on the heat rates (efficiency) of these units. Heat rate is directly related to economics and the generation of CO2. Cycling load increases heat rate (Btu/kWh) and CO2 emissions. For example, as the coal fleet annual capacity factor decreased from 64% to 54%, the heat rate increased from 10,100 Btu/kWh to 10,200 Btu/kWh. Poor heat rates mean less-efficient operation, that is, more fuel usage per MWh, higher maintenance costs, and more CO2 emissions per MWh.
The Department of Energy’s Dr. Robert K. Smith has reported the impact coal plant cycling has had on costs in the Western region. The analysis shows costs increase from $0.14/MWh to $0.67/MWh over the system, representing 2% to 7% of total production costs. As the capacity factor for coal has decreased, the capacity factor for simple cycle gas turbines has significantly increased (see Table 2 above). Simple cycle gas plants are being used for rapid ramping to fill the generation gaps due to the variability of wind and solar.
During this August 2019 period, the average capacity factor for the coal fleet was 54.8%, however, the hourly capacity factors ranged from 37.1% to 72.7%. Also, the percentage of energy generation from coal on an hourly basis remained relatively constant during this period. The gas fleet average capacity factor was 46.3% and hourly data ranged from 29.3% to 64.3%. These wide-ranging capacity factors not only impact heat rates, but also significantly increase plant operation and maintenance costs.
During winter months, there was a different profile (Figure 5) related to coal and gas generation. During the period of Jan. 25–31, 2019, for example, there were two load peaks per day. Coal and gas equally provided the bulk of the generation capacity during these periods. Nuclear remained constant and hydro generation peaked at high-demand times. Solar generation was different during the winter period; it peaked during low-demand times. Wind generation was more random during this period.
 |
|
5. U.S. electric generation energy source profile for the seven-day period of Jan. 25–31, 2019. Source: EIA |
During January, the price of natural gas for power generation was high and led to increased coal generation because it was more economical. Also, natural gas was restricted for power generation in certain regions due to limited pipeline capacity and residential heating use. For example, in the Consolidated Edison service area of New York, gas-fired plants switch to ultra-low-sulfur diesel when the temperature falls below 20F. During this period, the average capacity factor for the coal fleet was 60.0%, however, the hourly capacity factors ranged from 48.2% to 73.5%. The gas fleet average capacity factor was 32.8% and hourly data ranged from 23.4% to 45.0%. When gas turbines switch from gas to oil, there is an increase in heat rate and air emissions.
Regional Impacts
Another important aspect of the U.S. power grid is regional impacts. In some regions of the U.S., wind and solar energy generation are not as technically/economically viable as in other areas. Wind energy is limited in application in the Southeastern U.S. and Florida, while Texas, North Dakota, and California have excellent wind potential. Coal generation can make up some of the generation gaps in areas where wind and solar are limited.
On July 19, for example, the Electric Reliability Council of Texas (ERCOT) sourced 27.8% of its power from wind, while the state of Florida generated 0% from wind and only 1.3% from solar. The California ISO received 22.4% of its power from solar, while many other areas generated less than 1% from solar on the hottest day of the year. Consider, in July 2019, the price of natural gas for power generation was about $2.20/Mcf, which was about the same price as in 1998. The residential gas consumption in July was about 12% of what it was in January, which means gas was more readily available for power generation. Some regions have low nuclear capacity, which factors significantly into the generation mix. Coal is the prime generation source for the Midwest and Central U.S.
ERCOT provides additional hourly generation details that are not provided in the EIA database. ERCOT breaks out gas usage in generation between combined cycle units and other gas-fired power plants. ERCOT also provides biomass generation data. For July 19, ERCOT data shows that 15% (91.8 GWh) of the gas used in ERCOT’s system was by sources other than combined cycle units. Based on this information, it can be assumed that the bulk of this other generation was simple cycle gas turbines used for rapid ramping to compensate for variations in wind and solar generation.
Most simple cycle gas turbines have tested heat rates of about 11,300 Btu/kWh, which is higher than the average coal-fired power plant heat rate of 10,300 Btu/kWh. An important environmental point is that most simple cycle gas turbines do not have selective catalytic reduction systems for NOx control. Furthermore, additional infrastructure work must be done on the U.S. transmission system to allow energy generated by renewables to be moved into areas where renewable generation is limited.
A Complex Power System
The analysis shows that on a day-to-day and region-by-region basis, coal, gas, nuclear, solar, hydro, and wind all play a significant role in the U.S. power generation program. There should not be a rush to close coal plants, nuclear units, or other technologies without evaluating the available data and supporting infrastructure. When politics, technological changes, transmission and distribution system design, fuel cost, and self-interest are added to the equation, decisions concerning the generation mix become even more complex.
While coal-powered generation has been declining over the past 10 years and will likely continue to decline under economic, political, and environmental pressures, it remains a vital part of the U.S.’s energy generation base. The impact of coal in the generation mix must be evaluated on a micro basis (daily or seasonal), not on an annual basis. Without coal generation for two extreme weather days in 2019—Jan. 30, the peak winter day that year, resulting from a polar vortex event striking much of the country, and July 19, the peak summer day, with a heat wave engulfing the nation—the U.S. system demand for power could not have been maintained, which would have resulted in severe consequences.
In this rapidly evolving power generation world with more and more power being generated from variable renewable energy sources, it remains important to have readily available, baseloaded generation, and coal is still a key component in that mix. The U.S. generation system needs to have the flexibility to adjust to extreme weather episodes, such as polar vortex events, hurricanes, droughts, and other localized issues including power outages.
To maintain economic leadership, the U.S. requires an electric power system that is energy independent of international tensions, with a cost that promotes economic growth. Tax credits are causing an unnatural balance in the power system. The U.S. needs a balanced energy policy that considers the environment, economics, regional needs, security of supply, and system capacity requirements. In addition to transmission improvements, additional work must be implemented in coal-fired plants to improve their heat rate while cycling. Without performance improvements to coal plants, there will be additional closures. ■
—Anthony Licata is a partner with Licata Energy & Environmental Consultants Inc. Thanks to Paul Cleri, PE; Dr. Connie Senior; Arnold Feldman; and Frank Michell for their input on this article.