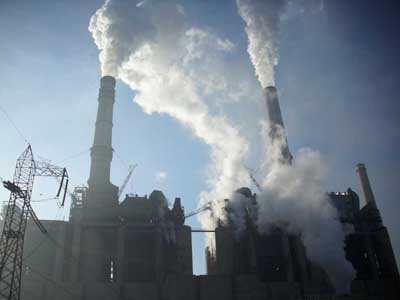
As limits on SO2 emissions become tighter, many coal-fired utility power plants are adding new flue gas desulfurization (FGD) systems or upgrading existing ones. The majority of these systems employ wet FGD technologies. Many plants with wet FGD systems use reheated flue gas to dry the saturated gases exiting the system’s absorber before they are sent to the stack.
However, due to the increasingly high cost of energy and/or the need to decrease total plant SO2 emissions, flue gas reheating typically is no longer used on new plants and is being eliminated at plants already in service. Without reheat, saturated flue gases exiting the absorber enter the stack directly. Along with droplets that are carried over from the mist eliminator, water vapor condensing from the saturated flue gases create a liquid film that covers the walls of the absorber outlet ducting and stack liner. This film must be collected and drained from the system by a process called wet stack operation. If the ductwork, stack liner, and liquid collection system are not properly designed, unacceptable amounts of liquid droplets may be discharged from the top of the stack.
Trouble-free operation of an FGD unit with wet ducts and stacks requires investigation of several potential problem areas related to the handling and discharge of wet flue gas. This must be done during the design of the stack and duct system. This article outlines the important design aspects that must be addressed if liquid discharge from a new or retrofitted wet stack installation is to be minimized.
Wetter is better . . . but
Although wet FGD systems have been used for decades, most operated with dry stacks. In the late 1970s, some utilities began using wet ducts and stacks to reduce their operating costs, but in many cases the (unforeseen) result of this switch was unacceptably high levels of stack liquid discharge (SLD). To improve understanding of the physical processes taking place in wet FGD systems, in the 1980s, EPRI sponsored a number of programs to determine the key variables contributing to liquid re-entrainment. The results of one of these studies were summarized in EPRI Report No. CS-2520, "Entrainment in Wet Stacks."
By the late 1990s many utility plants were operating with wet duct/stack systems—most equipped with liquid collectors—and a sufficient body of experience had been developed for EPRI to sponsor another program to develop practical guidelines for wet stack design and operation. The results of this study were summarized in EPRI Report No. TR-107099, "Wet Stacks Design Guide."
As the two reports detailed, the development of an effective wet stack installation requires a thorough fluid dynamic design of the wet duct/stack system and of the liquid collectors and drains. The design process, usually performed by a flow modeling laboratory with experience in this area, typically consists of five distinct phases:
- Phase 1—Initial review of the proposed system design
- Phase 2—Condensation calculations
- Phase 3—Design and development of the liquid collection system
- Phase 4—Study of the plume downwash
- Phase 5—Field installation and operational inspections
Using the results of the first four phases, utility engineers can finalize the design of the wet FGD system and write the specifications for supply and construction bids. The results of the fifth phase are used to support the installation of the liquid collection system.
Phase 1—Reviewing the initial design
Experience suggests that an early review of the proposed geometry of an absorber outlet duct and stack breach/inlet often produces recommended modifications for making the geometry more amenable to wet operation. This review should be performed by a consultant with broad experience in wet stack system design and operation. Key system design variables such as gas velocities, breach height and width, and liner diameter should be compared with values that have proven favorable for wet operation at other plants. Simple changes in system geometry, such as adjusting the breach aspect ratio, often can significantly improve the efficacy of the liquid collection system—by improving the flow patterns in the lower liner, minimizing the potential for liquid re-entrainment, reducing the total number of liquid collectors required, and/or reducing system complexity.
Many economic factors play a role in the design of a stack liner, including minimizing its diameter. But the primary controlling parameter for effective wet stack operation is the liner gas velocity. Different liner materials and construction techniques have different velocities considered favorable for wet operation. According to the EPRI "Wet Stacks Design Guide," well-constructed C276 and fiberglass-reinforced plastic (FRP) liners should be operated at maximum velocities of 50 to 60 ft/sec, whereas brick liners—with rougher surfaces—should be operated at gas velocities no higher than 35 to 45 ft/sec. If properly installed, modern materials, such as borosilicate block liners, can operate effectively at velocities up to 65 ft/sec (Figure 1, p. 22).
graph
Source: Alden Research Laboratory Inc.
1. Faster is better. Maximum stack liner gas velocities for four materials.
Sometimes the maximum recommended liner velocity must be reduced if there are horizontal discontinuities in the liner such as weld beads or FRP joints. These discontinuities can act as sites for liquid re-entrainment. Special care must also be taken to design the stack entrance area, where the gas flow is three-dimensional and very nonuniform, with velocities two or more times higher than the area-average value. Expansion joint locations in this area are particularly critical and, if at all possible, should not be located within one to two liner diameters of the top of the breach.
Phase 2—Making condensation calculations
Much of the liquid that must be removed from a wet stack is condensation on the duct and stack liner walls. It results from thermal condensation on the walls (the result of heat transfer from the flue gas to the outside air through the liner, insulation, annulus air, and concrete shell) and from adiabatic condensation of the saturated flue gas as it flows up the stack and expands as pressure falls with elevation.
The amount of thermal condensation on the duct and liner surfaces is a function of the stack’s geometry and thermal conductivity, its internal flow conditions, ambient temperatures and wind velocity, and—in some instances—wind direction. Thermal insulation can reduce the amount of thermal condensation on a stack liner. In practice, the addition of 2 inches of liner insulation has proven capable of reducing the quantity of thermal condensation by a factor of four.
As for adiabatic condensation, industry experience indicates that the relatively small pressure drop from the breaching duct to the top of the stack may produce an appreciable amount of liquid. A small fraction of this liquid will deposit on the liner surface due to turbulent diffusion, and the rest will be discharged from the liner as part of the bulk gas stream in the form of very small droplets. These droplets do not present a problem because they are so small that they will evaporate before reaching the ground.
Customized heat-transfer computer programs are used to calculate the total amount of liquid deposited on the stack liner walls due to thermal and adiabatic condensation. Such applications also can determine the rate of condensation, which is a function of ambient air temperature, wind velocity, and liner design variables. Both sets of calculations are needed to design and develop an effective liquid collection system, because the results will determine the number, size, and location of its gutters and drains.
Phase 3—Modeling liquid collection
The problem of SLD from a duct and stack system operating in "all-scrubbed" mode is exacerbated by the two-phase flow interaction of liquid and gas. The liquid enters the ducts and stack as droplets as well as condensed water vapor carried over from the mist eliminators of the absorbers. Rates of liquid carryover can increase significantly over "as designed" rates during normal wash cycles or if mist eliminators become fouled with normal use.
How much liquid and condensate is deposited is a function of flue gas velocity, duct and stack geometry, the liquid loading level, and the distribution of droplet size. The liquid films that form can move under the influence of gravity and gas shear forces. Any film that does move either will accumulate elsewhere or be re-entrained from liner walls, internal struts, dampers, or vanes and be discharged from the top of the stack by the high-velocity gases.
This re-entrainment process, in turn, is dependent on flue gas velocity, surface roughness, and surface discontinuities such as duct/liner weld seams or FRP liner joints. Liner expansion joints can be a major source of liquid re-entrainment if they are not properly located and arranged. Most of the liquid re-entrained within the stack does not redeposit on the liner wall; it exits the stack as droplets that are large enough to reach the ground before evaporating.
The behavior of droplets entrained in the gas flow from the absorber’s mist eliminators and the motion of the liquid films must be evaluated by a physical flow model of the unit. Such models facilitate the design and development of liquid collection devices capable of maximizing primary droplet deposition and liquid collection while minimizing the potential for re-entrainment of droplets from liquid pools and films. Computational fluid dynamics (CFD) models cannot be used for this purpose, because these computer codes, though effective at predicting droplet trajectories and droplet collection patterns, are currently incapable of accurately simulating the development and motion of liquid films on the duct and liner walls.
Physical flow models of wet duct and stack installations are usually built to a scale of 1:12 to 1:16. They typically encompass the system from the outlet of the absorber mist eliminator to a point in the stack liner approximately three to four liner diameters above the roof of the breaching duct. Typical single and multiple absorber wet stack flow models are shown in Figures 2 and 3, respectively. To the extent possible, models are fabricated from clear Plexiglss to allow detailed visualization of internal gas and liquid flows. To ensure that the liquid film motion in the primary collection zone of the lower liner is accurately simulated, care must be taken to ensure that the surface of the material used in this area has wetting properties similar to those found in the field.
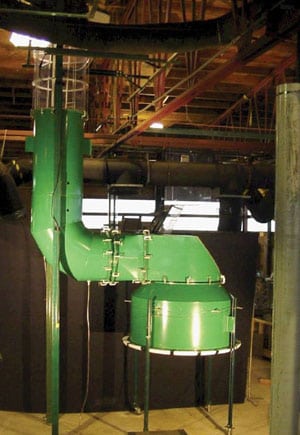
Courtesy: Alden Research Laboratory Inc.
2. One is good. A typical single absorber wet stack flow model.

Courtesy: Alden Research Laboratory Inc.
3. More is better. A typical multiple absorber wet stack flow model.
Use of a physical flow model enables droplet trajectories and the movement of liquid films to be observed as flow patterns. These patterns, in turn, can be used to design, develop, and optimize a system of vanes, gutters, ring collectors, dams, baffles, and drains capable of working effectively over a range of expected boiler loads and operating scenarios. To the extent possible, the liquid collectors and gutters are fabricated from commercially available structural shapes made of noncorrosive materials such as C276 or FRP.
Phase 4—Evaluating plume downwash
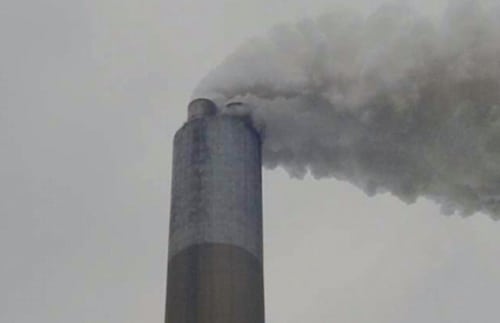
A crosswind at the top of a power plant stack will give the plume exiting it a horizontal component. As the ratio of vertical plume momentum to horizontal wind momentum decreases, the plume may become partially entrained in the wake formed on the downwind side of the liner and stack shell. At lower momentum ratios, the reduced static pressure in the wake can draw the flue gas into a downwash pattern along the downwind side of stack shell (Figure 4).
Courtesy: Alden Research Laboratory Inc.
4. Result of reduced static pressure. Plume downwash from the stack of a coal-fired power plant.
If the saturated flue gas drawn into this wake comes into contact with the roof and sides of the stack liners and the shell, problems involving metal corrosion, concrete deterioration, and ice buildup (during winter months) can arise. Plume downwash is particularly important to address for stacks with multiple, interacting discharge plumes. Severe downwash situations may even produce plume contact with lower surrounding plant structures. In the most extreme cases, plumes may touch down at ground level near the stack.
The interactions between the prevailing wind and the individual plumes also play a significant role in the propensity and extent of downwash for stacks with multiple flues. The wind direction relative to the plumes can produce different degrees of downwash. For a given ratio of vertical to horizontal momentum, plume downwash will be greater in a dual-liner stack if the direction of the prevailing wind is perpendicular to the axis of the two liners, compared with a condition in which the wind direction is parallel to that axis. Evaluating the downwash potential for two (or more) wind directions allows definition of the maximum downwash potential and development of appropriate liner extensions and stack top geometry to mitigate the problem.
Ultimately, all stacks can enter into downwash mode at low unit load and at high wind velocities. The only questions are:
- Under what conditions and how frequently will downwash occur, given the expected boiler load schedule and wind frequency profile?
- How much downwash is considered acceptable?
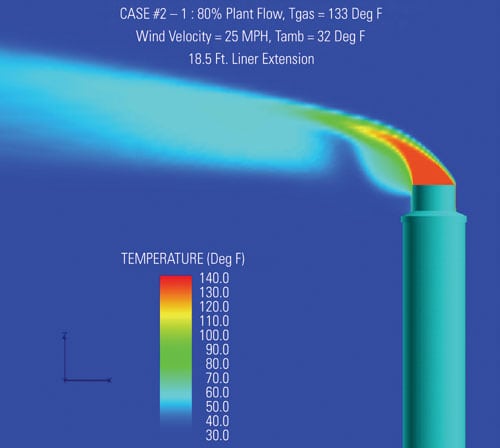
In contrast to simulations of liquid collection systems, CFD modeling is ideally suited for evaluating the variables of downwash, a phenomenon resulting almost entirely from gas-gas interactions. Figure 5 presents a typical output from such a model showing good stack operation without downwash. Various liner velocity/atmospheric conditions can be evaluated to determine the liner extension height or the exit choke size reduction required to eliminate downwash or the extent to which the top of the stack shell should be covered with an acid-resistant coating. The potential for stack top icing also can be evaluated by including heat transfer in the model and by predicting how quickly the plume will cool after exiting the stack.
Courtesy: Alden Research Laboratory Inc.
5. Very predictable. Typical results of a computational fluid dynamics model of plume downwash.
Phase 5—Supporting installation and operation
The results of this phase are used to support field installation of the liquid collection system. Field construction and installation drawings of the system should be reviewed by the engineers who designed and developed it, to ensure that their recommendations have been interpreted correctly and to evaluate any changes made by the installation company to facilitate fabrication, assembly, installation, or structural support.
During field installation, deviations from the specified design are often required due to unanticipated interferences or installation issues. To ensure that the liquid collection system has been installed properly, an on-site inspection of the installation by its designer is highly recommended and should be scheduled for a day when the installation is 80% to 90% complete. This way, errors can be identified, on-the-spot modifications can be defined if necessary, and corrections can be made while the construction crew is on-site before the unit start-up.
Inspecting the liquid collection system after several months of operation is also highly recommended. If any stack emission incidents occur during normal operation, the need for inspection is obvious. However, even if SLD is not experienced, it still is important to inspect the liquid collectors as a way to ensure their satisfactory long-term operation. These inspections may reveal incipient deposition and drainage problems that can then be corrected during future plant outages.