In an exclusive agreement with the EUCG Nuclear Committee, POWER was provided access to some key, high-level performance and operational data from the group’s nuclear industry benchmarking database. All U.S., and many international, nuclear power plants are members of the committee and have contributed to its database for many years. This month we introduce you to the EUCG Nuclear Committee and share sample nuclear operating costs. Look for future reports on other key performance benchmarking metrics during 2010.
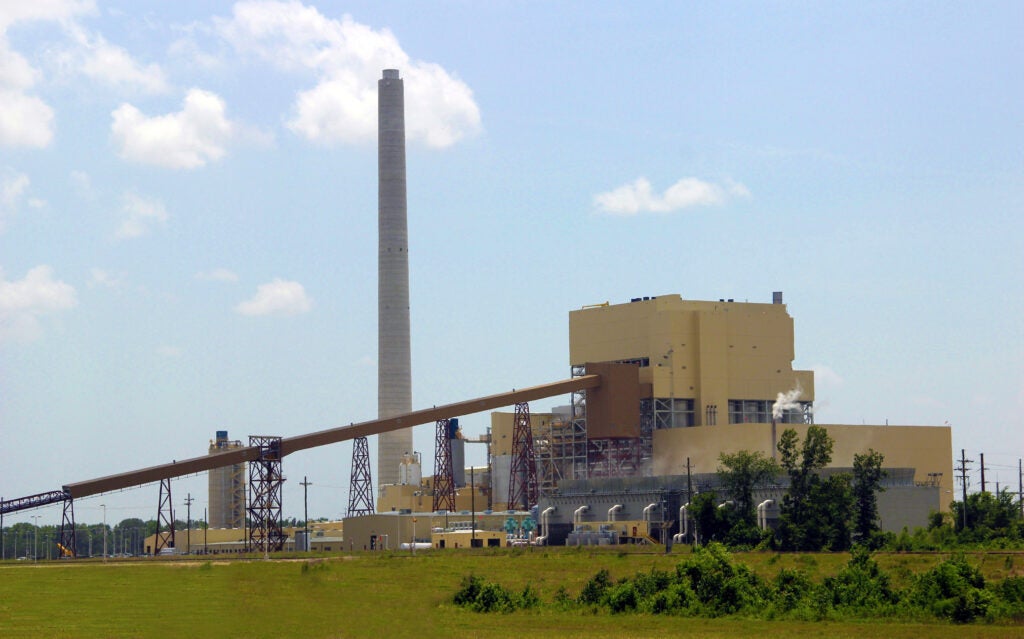
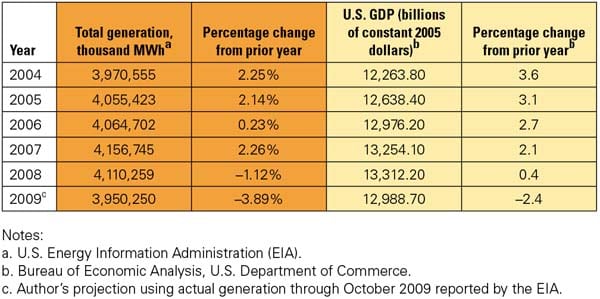
The nuclear power industry enjoyed another banner year in 2008. The industry’s average plant capacity factor remained above 90% for the second year in a row, and the 104 U.S. nuclear power plants (35 boiling water reactors and 69 pressurized water reactors) produced more than 800 million MWh — just a tenth of a percent less than in 2007. Sixteen of these plants recorded capacity factors greater than 100%, which is a phenomenal achievement. Exelon Corp., for example, reported that its 17 reactors finished the year with a fleetwide average capacity factor of 93.9% and operated above 93% for the sixth consecutive year. In comparison, the industry average for coal-fired plants is about 70%, and for wind turbine plants it was slightly less than 25% in 2008, according to the U.S. Energy Information Administration.
Equipment and controls upgrades at nuclear plants have also increased the rated power output of selected plants over the past few years. During 2008 alone, the Nuclear Regulatory Commission (NRC) approved a combined 726 MW of power uprates, which are normally unavailable to coal-fired plants, given the limitations of the Clean Air Act’s New Source Performance Standards. Since 1977, the NRC has approved some 124 nuclear power plant uprates, representing about 5,640 MW of added capacity — roughly equivalent to constructing another five complete nuclear power plants. (See "Nuclear Uprates Add Critical Capacity" in the May 2009 issue of POWER.) If you consider the enormous increase in the industry’s average capacity factor over the past 20 years, improved plant operations are equivalent to at least another dozen plants (Table 1).
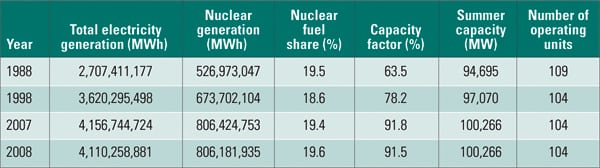
Table 1. The nuclear industry received an “A” on its 2008 report card. Source: Energy Information Administration
The nuclear uprate program that is driving these upgrades remains strong. There are currently nine power uprate applications in the NRC queue awaiting approval that total another 949 MW. In addition, the NRC expects nuclear operators to submit a total of 40 uprate applications between now and 2013, representing another 2,075 MW of installed capacity. For example, Exelon announced in late September a series of power uprates across its fleet that will increased the rated capacity of its plants between 1,300 and 1,500 MW within eight years "without turning a spade of earth," said Exelon Nuclear President and Chief Nuclear Officer Charles (Chip) Pardee at the press conference. "With these uprates, we will be able to produce the equivalent output of a new advanced nuclear reactor, and we’ll bring it to market in a timeframe commensurate with the fastest new construction."
EUCG Becomes the Industry Standard
There are many reasons why the nuclear industry’s performance has made such a dramatic improvement over the past two decades, especially in terms of increased capacity factors, improved safety, and keeping the price of electricity at the busbar very low. Attention to operations and maintenance has certainly improved, but so have the entire work process planning and scheduling processes. Where the length of a refueling outage was measured in weeks or months a decade ago, today, it is down to a couple of weeks. Improved computerized information management systems, human productivity and work processes, and effective leadership all share credit for the industry’s excellent performance. In addition, and perhaps most importantly, these performance improvements occurred while maintaining a high level of plant safety and quality assurance — the yin and yang of every nuclear power plant.
Another significant cultural change over the past two decades was that nuclear operators established performance measures that were objective, measurable, and related to results. However, the only way to accomplish this goal was to have a source of validated, consistent data that nuclear power generators could use to compare their performance with that of their peers. That is when the EUCG (formerly known as the Electric Utility Cost Group) stepped in and, working with other industry organizations, developed a common set of cost and data definitions. When the industry approved those definitions, comparable performance data were used to populate the EUCG’s Nuclear Integrated Information Database (NIID).
The EUCG subsequently prepared a series of benchmarking reports for its members. Since then, benchmarking has grown far beyond just comparing standard performance metrics, such as capacity factors and length of refueling outages, to identifying best practices and implementing continuous improvement programs.
Today’s NIID includes plant and unit performance and cost data, operating and outage cost data, capital cost investments, staffing information, and more. The database, originally developed in 1986 and updated annually for its participating members, is recognized as the most comprehensive source of nuclear plant data in the world. However, EUCG data are shared on a "give-to-get" basis among members, meaning that the data are only available to members that participate by providing their plant data.
Defining Consistent Data
Clear process definitions are the prerequisite for collecting comparable data from different plants. Without a common lexicon, it would be pointless to use the data for benchmarking purposes. Developing new processes, and maintaining existing ones, has been a coordinated effort between the EUCG, the Institute for Nuclear Power Operations, the Electric Power Research Institute, and the Nuclear Energy Institute (NEI).
The process definitions are organized into nine top-level groups that are defined as "level zero" processes:
-
Operations. Includes operations, environmental, chemistry, and radiation protection.
-
Design engineering and configuration management. Includes design changes and physical configuration management.
-
Work management. Includes planning and scheduling, preventive and corrective maintenance, and tool calibration.
-
Plant engineer and equipment reliability. Includes long-term planning and life- cycle management, performance monitoring, and continuous equipment reliability improvement.
-
Materials and services. Includes materials management and warehousing, contracts and purchasing, and material disposal.
-
Support services. Includes information technology, business services, human resources, and executive offices.
-
Loss prevention. Includes security, quality assurance and control, corrective action program, emergency preparedness, and safety and health.
-
Training.
-
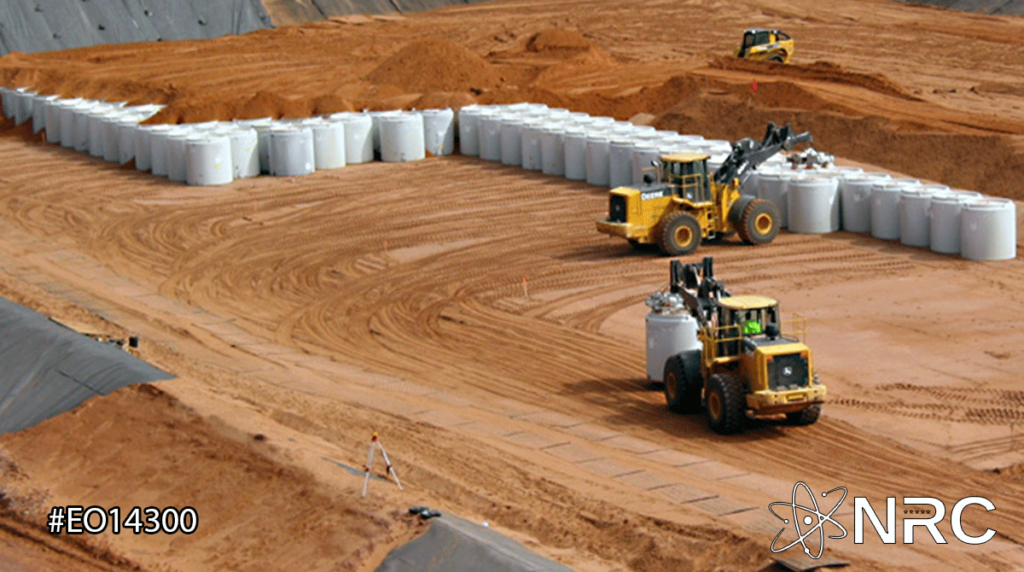
Nuclear fuel. Includes fuel management, transportation, handling, storage, and disposal.
Each of the nine processes is further divided into 46 sub-processes or "level one" processes in the NIID. Member companies can define additional sub-processes into activities (level two) and tasks (level three). However, industry standardization occurs only at "level zero" and "level one" processes.
The process definitions define how to collect and allocate costs and other important data. In addition to cost data, the NIID also contains key performance indicators (KPIs) and staffing data, making it a very useful tool for benchmarking. Many other metrics can be derived from the NIID, giving the database user extra flexibility to design additional metrics. Specifically, the types of data collected and stored in the NIID include:
-
Cost data. Nuclear operating and generating costs are collected for most level one and level two functional processes or sub-processes. The differences between operating and generating costs are discussed later in this article.
-
Key performance indicators. KPIs measure process characteristics in quantifiable terms and usually are economic in nature. KPIs are tracked throughout each level of the hierarchy or may be derived from or consist of combinations of other KPIs, cost data, or staffing data and be reported at the appropriate level. For example, "Unit Capability Factor" is reported at the unit level, whereas "Productivity Factor" (MWh generated/full-time employee) is reported at the plant level. This difference is important when there is more than one unit at a plant site.
-
Staffing data. Staffing data allow human performance calculations and cost comparisons. For example, both cost and staffing data are required to compare utilities that outsource with those that rely on permanent employees to perform different types of work. Staffing data allow the user to make comparisons between similar plants and processes. Staffing data, like cost data, are reported at the plant level and include on-site utility employees, off-site corporate support, and baseline contractors.
Comparing Nuclear Plant Operating/Generating Costs
The EUCG Nuclear Committee is the nuclear industry’s preeminent organization for economic and performance benchmarking data and has the most comprehensive and accurate nuclear industry cost and staffing database in the world because the data come directly from plant operators. Therefore, those who rely on other sources of nuclear industry performance data do so at a risk. For example, the NEI presents data on nuclear plant operations developed by a database vendor that interprets Federal Energy Regulatory Commission Form 1 filings and models the costs of unregulated plants to estimate nuclear plant production costs. Those data sets also exclude any indirect costs. Determining indirect costs is very difficult because it requires a detailed understanding of the peculiarities of utility economics and cost reporting processes at each plant. The EUCG database has none of those shortcomings.
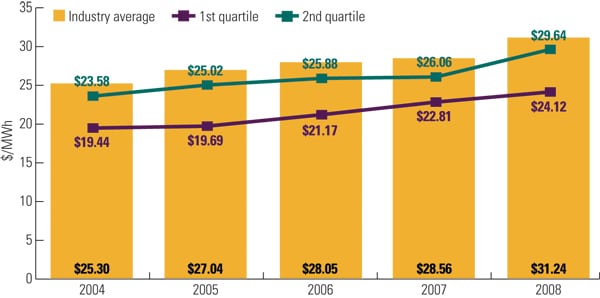
Here’s an example of the differences between data from the EUCG and the data source used by the NEI. The NEI nuclear plant operating data presented on its web site show that "production costs" (defined as all operating costs plus fuel) for the top quartile of plants, averaged for the period 2006 to 2008, were $16.1/MWh (1.61¢/kWh). The EUCG data, as reported directly from its members, average $17.44/MWh, as you’ll see in Figure 5 — about an 8% difference. The lesson learned here is to carefully consider the source of your data.
The nuclear industry continues to have the lowest cost of electricity generation in the power industry, so examining those costs is a good demonstration of the NIID’s capability. The data were accessed by performing a series of queries on the NIID to determine the available operating cost data on a per-MWh basis. The NIID has a web-based query and reporting tool — the same tool used by plants to add their latest performance data to the master database. (You will note that the actual plant names are blinded, in compliance with anti-trust rules. The complete data set is only available to members on a "give-to-get" basis: You provide your plant’s data sets, by unit, and then you have access to the entire database.)
The cost and performance data are available by unit, enabling the user to select relevant and accurate peer groups (plant, unit, technology, region, and the like) for benchmarking studies. (Although the database includes several plants in other countries, we provide data for just U.S. plants in this article for easier comparison of plants with similar operating constraints.)
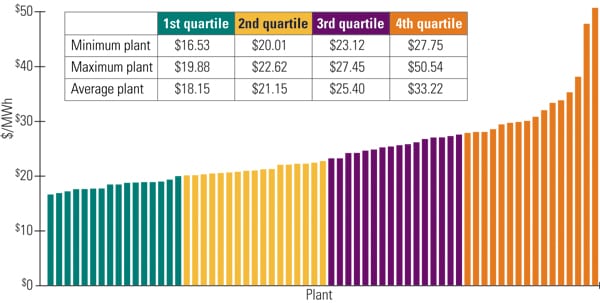
POWER made a series of queries of the NIID to obtain detailed production cost data. The three key queries were for 2008 data, industry average data for 2006 – 2008, and five-year industry data (2004 – 2008). Within each key query, detailed cost data were requested using standard EUCG definitions: operating costs (sum of plant, support, and other related costs), total operating costs (operating costs plus fuel), and total generating costs (total operating costs plus capital invested — normalizing the various capitalization policies among utilities) — all in $/MWh. The data from each query were then automatically formatted into benchmarking quartiles and bar charts. The results from these nine queries are presented in Figures 1 through 9.

1. Operating costs for 2008. The EUCG defines “operating costs” as the sum of plant, support, and other related costs, without fuel or capital investment expenses. Note that the data are reported by each of the 65 nuclear plants in the U.S., not by individual units. Individual unit data are available to members of the EUCG Nuclear Committee. Source: EUCG
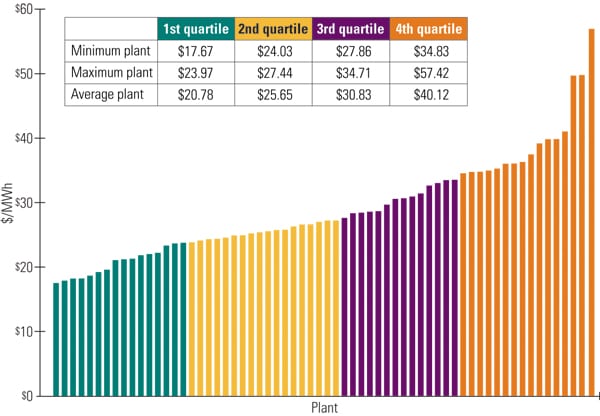
2. Total operating costs for 2008. The EUCG defines “total operating costs” as the sum of operating costs plus fuel, but not capital investment expenses. The average cost of fuel for plants in each quartile can be found by subtracting Figure 1 data from that of Figure 2. Source: EUCG

3. Total generating costs for 2008. The EUCG defines “total generating costs” as the total operating costs plus capital investment expenses—a fully loaded cost. Source: EUCG

4. Operating costs, average for 2006–2008. Source: EUCG

5. Total operating costs, average for 2006–2008. Source: EUCG
6. Total generating costs, average for 2006–2008. Source: EUCG
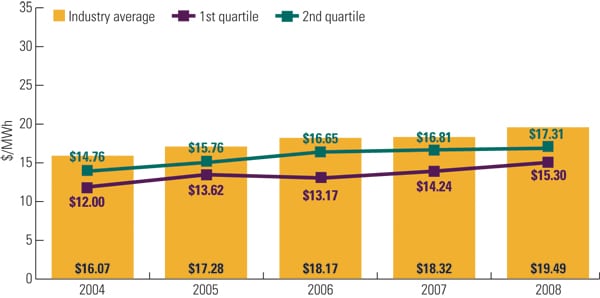
7. Operating costs, industry annual average for 2004–2008. Source: EUCG

8. Total operating costs, industry annual average 2004–2008. Source: EUCG
9. Total generating costs, industry annual average for 2004–2008. Source: EUCG
The NIID also features standard benchmarking reports and graphics that give users more time for data analysis and require less time for constructing graphs and charts. In addition, the NIID has been updated with an optional "purchasing power parity" feature that accounts for international currency fluctuations. Clearly, the EUCG’s worldwide reputation as the source of the most comprehensive nuclear benchmarking data available is well deserved.
—Dr. Robert Peltier, PE is POWER’s editor-in-chief.