How does your company prepare and share fossil plant performance data? What data are important, and how much effort is required to collect and report the data? What are the most important statistics for reporting key fossil plant operations? The latest EUCG benchmarking survey reveals the favored fossil performance metrics at several of the largest utilities in eight key categories.
A number of important and proprietary EUCG benchmarking surveys have been summarized in POWER over the past few years. Those articles, whose information was derived from member surveys conducted by the EUCG Fossil Productivity Committee, covered boiler tube failures (October 2009), the installed cost of environmental equipment such as scrubbers (July 2007, updated March 2009) and selective catalytic reduction systems (February 2006), and various staffing issues (maintenance staff in February 2008 and plant engineering staff in August 2006). All the EUCG benchmarking surveys reported on by POWER can be found in the online archives at https://www.powermag.com.
One of the EUCG’s key goals is developing process and market benchmarks, unit reliability strategies, and best-practice applications to foster performance and efficiency within the power generation industry (see sidebar). Although the topics of future benchmarking surveys are selected by the entire committee membership at each meeting, details of the final survey data—suitable for benchmarking any plant’s performance against peer group performance—are available only to the EUCG members that participate in a given survey. This “give to get” relationship between members motivates wide survey participation. Only a top-level summary, such as we provide in this article, is available to companies that did not participate.
The latest Fossil Productivity Committee survey explored the type and usage of fossil plant performance measures as plant- and fleet-level reporting and target-setting metrics. The survey explored the specific performance measures that fossil-fired plants are using as well as how their data is collected, how frequently it is reported, at what levels it is reported, and whether the data is used to determine compensation for employees or is only reported for informational purposes. The goal was to present the usage frequency of favored performance metrics so that member organizations could improve their individual plant and corporate processes.
Given the breadth of that survey and the significant results, this report has been prepared in three parts. In Part I we report on station-level metrics. Part II will report on company-level metrics. Both of these reports focus primarily on past performance metrics—lagging indicators. In Part III we will examine favorite prospective, or leading, indicators at both the plant and fleet level that are used for compensation and for process improvement purposes.
Committed to Performance Reporting
The survey was conducted over a three-month period in mid-2010 with a total of 13 major U.S. utilities that have large fossil-fueled fleets, such as American Electric Power, Tennessee Valley Authority, Southern Company, and PSEG Power, as well as utilities from Israel, Korea, and Canada. For the purposes of this article, three fossil fleet–size groupings were established: small (up to 5 GW), medium (5 GW to 10 GW), and large (over 10 GW). Of the 16 companies participating in the benchmarking survey, eight were classified as having “small” fossil-fueled fleets, three as “medium,” and five as “large.”
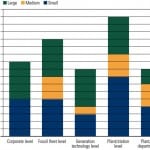
Overall, the use of performance metrics in the 16 utilities in the survey group appear to be well established throughout each company (Figure 1). Thirteen of the 16 respondents reported that data on performance measures have been collected and reported for more than five years. However, the method used to collect the data varied widely: nine companies reported that data is collected by a corporate or centralized collection and reporting group; five use a fossil-organization central group; and only one collects data as a plant-level organization. One large utility used a combination of central and decentralized data collection and reporting groups.
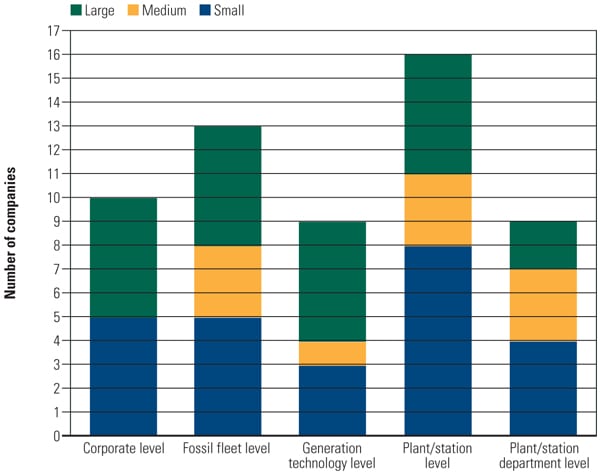 |
| 1. At what level in the company or organization are performance measures used? Each of the 16 plants that participated in the survey collects data and produces plant-level performance reports. However, not every plant uses the same metrics or the same number of metrics. As this chart shows, the final performance data reports do not appear to be uniformly passed down to plant departments, nor are they required by all fleet-level managers or company-level executives. Source: ECUG |
Of the 16 reporting utilities, 11 respondents (69%) use some combination of manual, spreadsheet, and automated data collection and reporting; only one organization reported that it has completely automated the reporting tasks. Of the five large utilities in the survey group, four reported using “some automation.” Most also reported that the combination of data collection and reporting processes typically include some automated downloads from the plant distributed control system or PI systems, key parameter tracking with spreadsheets, downloading data from external sources such as Generation Availability Data System (GADS) (reports collected by the North American Electric Reliability Corp. [NERC] or other benchmarking data collection systems), data downloaded directly from continuous emission monitoring systems, and so on. Virtually all respondents reported that some data was collected manually.
The level of effort required to collect performance data and prepare reports varied significantly among utilities. Fifteen respondents prepared monthly reports, and about half also prepared quarterly and annual reports. Annual reports were reported as “critical” because they are often used for performance reviews, compensation decisions, and data reporting to outside agencies. Only a single large utility reported less than one full-time equivalent (FTE) position dedicated to these tasks. The average among respondents was approximately four FTE for a fleet. The largest number of FTEs dedicated to fossil plant performance data collecting and reporting was reported as 15 FTE by one small fleet utility.
The survey asked how completed reports are distributed to plant staff and company-wide. At the plant level, most utilities distribute the reports either by hard copy (69%) or email (63%), but only half reported that the performance reports are available on the Internet or a company intranet. Twenty-five percent reported that the reports are shown on plant monitors. The results were evenly distributed by utility size. Regarding company-level reporting, only half said that they distribute the reports by either hard copy or email, although 63% said that the reports are posted on the Internet or intranet.
Standardized Reporting Processes
Surprisingly, there was only one utility that reported that its plant performance measures were not standardized across its fleet. This one company indicated that it chose different metrics for different technologies of plant. For example, coal plants are dispatched differently than combustion turbines (CTs) because they perform a different mission in the market. As a result, the focus may be more on starting reliability for CTs and forced outage rates for baseload coal units. Generally, NERC/GADS measures and definitions have been adopted; they offer reporting consistency, which is essential for benchmarking between fossil fleets and between individual plants.
Eight significant station-level performance measurement categories were reported by survey respondents, and the top 10 results (or fewer if there were fewer responses) in each category are summarized in Figures 2 through 9. Survey respondents were asked open-ended questions about the metrics used at each plant in their fossil fleets, and the number of responses were then assembled and reported by frequency in each of those eight categories.
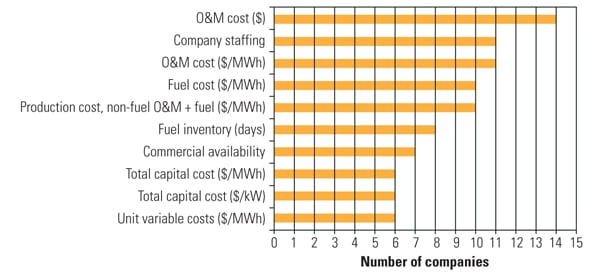 |
| 2. Financial measures. At the station level, the survey results found that operation and maintenance (O&M)–related costs took four of the top five places for financial measures reported, as a fixed sum or as a function of generation. Interestingly, the fuel cost component in the electricity production cost was tracked as often as the sum of non-fuel O&M and fuel costs. Capital costs, per unit of installed capacity and per unit of generation, rounded out the top 10 financial measures reported. Enhanced production costs (non-fuel O&M plus maintenance capital plus fuel) were reported in the second tier of metrics (survey responses not shown on the figure) even though the metric is the sum of other popular metrics in the figure. Many other metrics were reported by three or fewer companies, such as administrative and general overhead budget, FTE/MWh, maintenance capital ($/MWh), O&M material costs, and O&M overtime costs; these are not shown in the figure. Source: EUCG |
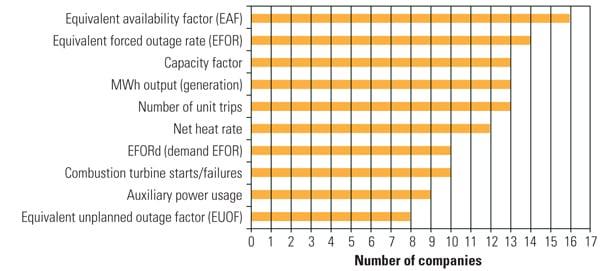 |
| 3. Operational measures. The favored operational metrics are the familiar EAF, EFOR, capacity factor, EUOF, generation, and net heat rate. Surprisingly, EAF was the only metric identified as used by all 16 utilities. Number of unit trips also scored high, even though it is closely related to the other, higher-rated statistics. Not making the top 10 list were metrics such as water chemistry, dispatch availability (the automatic generation control index), or any particular system performance measures, such as those of the boiler or turbine. Source: EUCG |
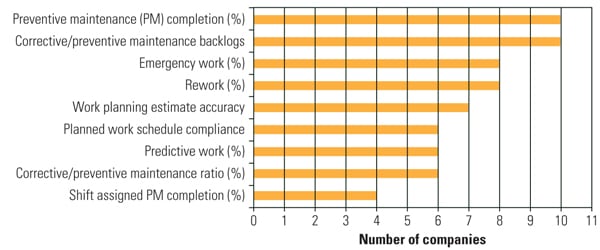 |
| 4. Maintenance measures. There were just nine maintenance measures that collected four or more votes, and only two measures collected 10 votes: PM completion rate and backlog. Half of the survey respondents included rework on their list of important maintenance measures; only six focused on predictive work reporting. Source: EUCG |
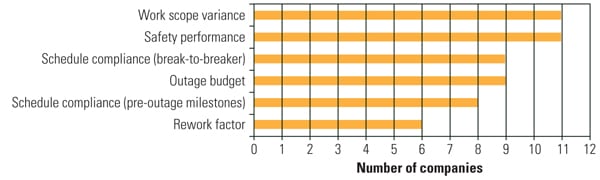 |
| 5. Planned outage measures. Only six planned outage measures were reported, and safety appropriately led the list, although for only 11 of the 16 survey respondents. Staying within the outage budget and schedule was reported by nine utilities as an important metric. Source: EUCG |
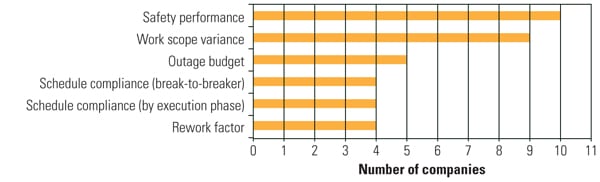 |
| 6. Forced outage measures. Only six forced outage measurements were reported by survey respondents. As with planned outage measures, safety led the list by getting votes from 10 utilities. The remainder of the list illustrates that few of the reporting utilities actively track and report on forced outage metrics. Forced outages are by definition unplanned, yet five utilities track an outage budget and schedule performance. Source: EUCG |
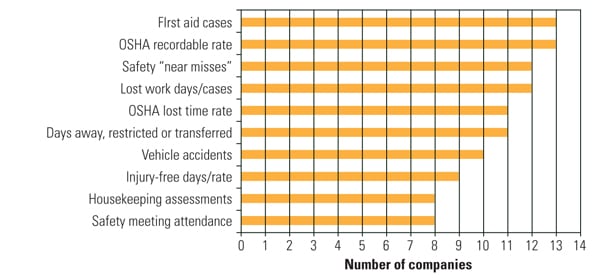 |
| 7. Safety measures. The top 10 safety measures reported by the 16 utility survey respondents are shown. It is notable that contractor recordable accidents did not make the list. Altogether, another 12 safety measures were reported in the survey results by five or fewer utilities, such as days since last lost time accident, accident severity rate, contractor Occupational Safety and Health Administration (OSHA) incident rate, and a number of human performance events. Source: EUCG |
 |
| 8. Environmental measures. Half or more of the survey group reported the top 10 environmental measures shown on this chart, although only SO2 and NOx emission rates were listed by all 16 utilities surveyed. However, ozone season NOx compliance failed to make the top 10. Another 11 measures not shown were reported by six companies or fewer, such as effluent monitoring and hazardous waste generation. Source: EUCG |
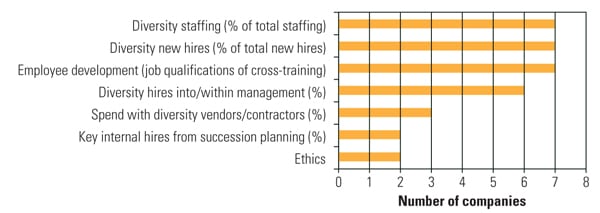 |
| 9. Diversity measures. Given the survey results, it seems that a marginal number of utilities track plant staff diversity. Second-tier metrics not shown in the figure and reported by only two or fewer utilities include absenteeism rate, training hours per FTE, and the number of staff on limited duty or on disability. Source: EUCG |
Note that the data reported on in these figures is not segmented by utility size ranges, although the database provided to those that participated in the study can be sorted to provide true peer comparisons. The good news is that if you are interested in the complete database, you can join the EUCG and complete the survey. The complete survey database will then be made available to you.
In Part II, we will look at this same data from a corporate or fleet viewpoint and discuss the differences with results reported in this article. Part III will examine more predictive metrics, including those used for compensation programs at the surveyed utilities.
— Charlene Foltzer (charlene.foltzer@pseg.com) is performance & metrics manager at PSEG Power in New Jersey and a member of the EUCG’s Fossil Productivity Committee.