Part II of this three-part series moves up the typical utility organization to consider important fleet-level fossil plant operating metrics. This portion of the EUCG-sponsored benchmarking survey found that utilities favor fleet-level metrics that are similar to plant-level metrics but assign them different priority. Utilities generally agreed on what were important metrics in the eight categories examined, although none were favored by a majority of the surveyed utilities.
Last month’s issue published summary results from the portion of a recent EUCG benchmarking survey that focused on plant-level fossil plant performance metrics. This second part of a three-part series looks at common metrics used for reporting fleet-level performance at fossil-fueled plants. A top-level view of the type of performance metrics used in the surveyed organizations is presented in Figure 1. A discussion of the process used for collecting data, the frequency of collection, the form in which raw data is made available, and internal distribution of the plant and fleet performance data reports was included in Part I.
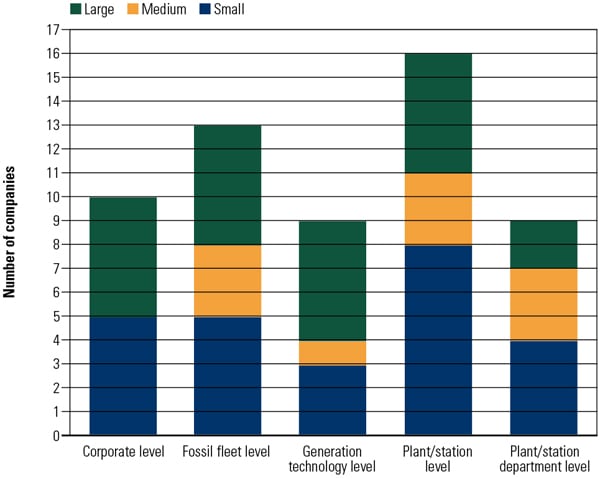 |
| 1. What performance measures are used in the surveyed organizations? The EUCG benchmarked 16 companies to identify the most popular fossil plant performance metrics and where those metrics are used in the organization. As the chart shows, the level at which performance metrics are collected and reported is not uniform across the benchmarked companies. Part I looked at plant-level metrics; this article presents fleet-level metrics and the differences between plant- and fleet-level metrics. Source: EUCG |
The goal of the survey was to discover and share the usage frequency of favored performance metrics so that member organizations could benchmark their internal metrics with those of other industry leaders and, hopefully, institute plans to improve their individual and corporate processes. The survey was conducted in mid-2010; a total of 16 major utilities in the U.S., Canada, Israel, and Korea participated. Fleet size for each utility was identified as either small (up to 5 GW), medium (5 GW to 10 GW), or large (over 10 GW). Of the 16 companies participating in the benchmarking survey, eight were classified as having small fossil-fueled fleets, three as medium, and five as large. The survey covered all fossil plants within particular fleets, which, by design, include coal-fired and natural gas–fired steam units, combined cycle plants, and even combustion turbines used for emergency peaking.
Comparing Results
The previous article looked at eight significant station-level performance measurement categories, and the top 10 results (or fewer, if there were fewer responses) in each category were reported. For consistency, the same eight reporting categories were used for fleet-level reporting measures. To make a proper comparison with the measures reported earlier, both plant-level and fleet-level measures are included in Figures 2 through 9. The data is sorted on decreasing number of fleet-level survey responses, thereby illustrating differing reporting priorities. A blank means there were no survey responses.
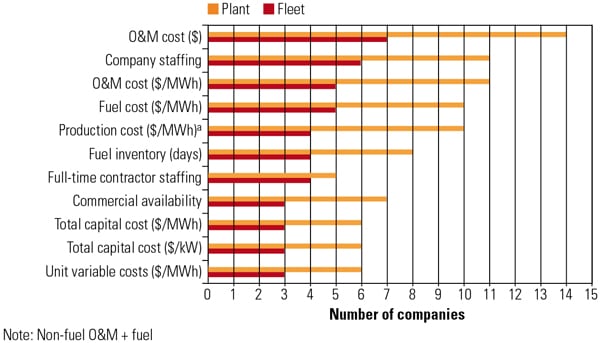 |
| 2. Financial measures. Survey results demonstrate that the priority given to financial measures reported at the fleet level (shown in red) closely mirrors the priority at the plant level (shown in orange) for the 16 companies that participated in the survey. Companies chose the same top 11 financial measures, but with different frequency at the plant and fleet levels. Many other metrics were reported by fewer than three companies, such as administrative and general overhead budget, FTE/MWh, maintenance capital ($/MWh), O&M material costs, and O&M overtime costs; these are not shown in the figure. Source: EUCG |
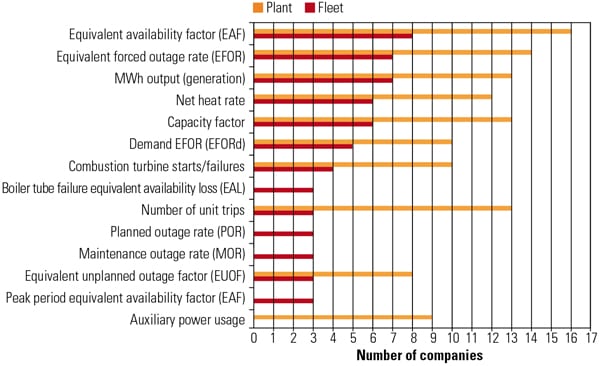 |
| 3. Operational measures. The top seven operational measures at the plant level were also the top seven at the fleet level, but in a different order. Only half of the fleets responding to the study use EAF as a metric for tracking fleet performance. A number of companies reporting on fleet-level metrics selected performance measures that are completely different than those used at the plant level, such as planned outage rate, maintenance outage rate, and boiler tube failures. Only auxiliary power usage appeared at the plant level but not at the fleet level. Source: EUCG |
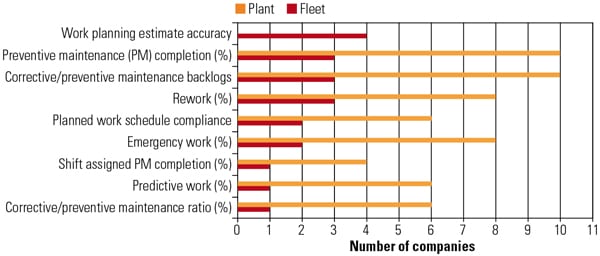 |
| 4. Maintenance measures. When plant-level maintenance measures were reported, only nine metrics collected four or more votes and only six focused on predictive work reporting. Those same nine measures also collected the most fleet-level survey votes, although a third were reported for only single fleets and two more measures were reported by only two fleets. Source: EUCG |
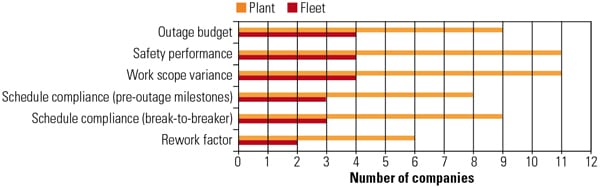 |
| 5. Planned outage measures. Survey results showed that only six planned outage measures were used by the 16 reporting companies. Though the same measures were reported as used at both the plant and fleet level, in nearly the same priority order, at best, only 25% of respondents routinely reported these measures at the fleet level. Source: EUCG |
 |
| 6. Forced outage measures. Although only six forced outage performance measures were reported at the plant level, the same ones were favored at the fleet level, although in much lower numbers. The favorite fleet-level metric was safety performance, although only 25% of the participating fleets reported using this metric. Source: EUCG |
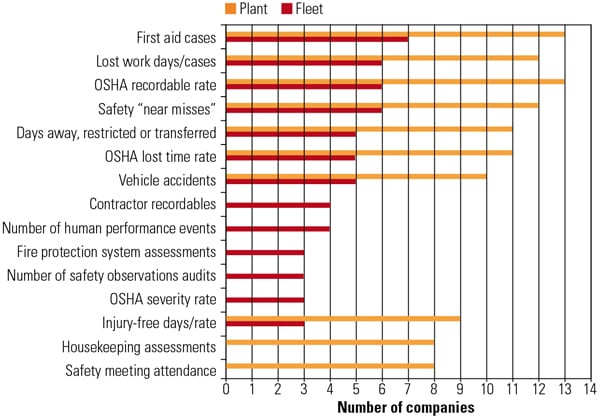 |
| 7. Safety measures. The most common plant-level safety measures reported are also the top priority at the fleet level. However, another dozen safety measures were reported by five or fewer utilities at the fleet level. Another noticeable difference between the two levels is that housekeeping assessments and safety meeting attendance are used at the plant level but not at the fleet level. Source: EUCG |
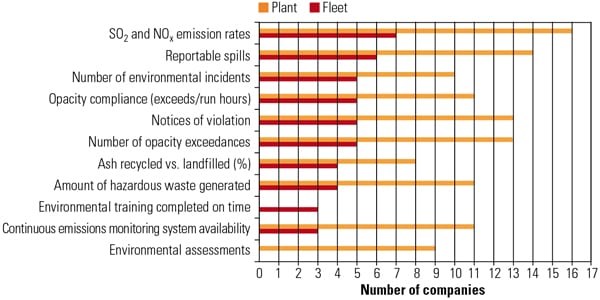 |
| 8. Environmental measures. Reporting results were the most similar at plant and fleet levels for environmental and safety measures (Figure 7). Strangely, SO2 and NOx emission rates and opacity exceedances are reported at the fleet level by less than half of the reporting utilities. Source: EUCG |
 |
| 9. Diversity measures. Less than half of the utilities report diversity efforts at the plant level. Although the eight favorite reporting measures are common between plant and fleet levels, only 25% of the fleets report diversity measures of any type. Source: EUCG |
The differences between the plant-level and the fleet-level performance reporting measures are startling at first glance but must be considered within the context of the survey and how fleet statistics are typically collected and used.
Of the 16 utilities that participated in the survey, many have fossil fleets that are predominately coal-fired, but others use a mix of fossil fuels that include natural gas– and oil-fired combined-cycle plants. Others include a substantial number of oil- and natural gas–fired simple-cycle combustion turbines. Some of the surveyed utilities have fleets that operate in a fully regulated environment, while other fleets operate in deregulated regions and compete with merchant generators for energy sales. In other words, we should expect differing performance metrics across fleets because each fleet will have different operating missions.
There will also be differences between plant-level performance metrics and fleet-level metrics reported in the survey because each has different operating and maintenance (O&M) reporting priorities. For example, if a fleet is having a particular problem across several units—say, water wall tube leaks—then the fleet-level executive will usually elevate that problem to a fleetwide initiative and invest resources to resolve the problem. These fleet strategic objectives can change year to year and are expected to leave the list when a problem is resolved. If water wall tube leaks were not a problem with a majority of the plants included in the survey, then that item would not be reported with much frequency, especially for those fleets with many new combined-cycle plants. But if it was on the fleetwide initiatives list, then we would expect water wall leaks to be reported with some frequency as a fleet issue, as it was. However, these fleetwide initiatives are short-term and limited to a few key issues that can be properly managed.
Other fleet-level factors also account for differences between plant- and fleet-level reporting priorities. For example, different fleets have differing capitalization policies for maintenance work, so a particular cost that one company calls an O&M expense another classifies as a capital cost. Some companies may budget overhaul equipment purchases and services at the fleet level and capitalize the costs. Others may do the same budgeting at the plant level and expense the work. Most company capitalization policies have been set for a long time, and they rarely change. Also, for some companies, non-fuel O&M budgets are established at the fleet level and then are parceled out to individual plants.
Budgeting processes can also be poles apart between different plant technologies within a single fleet. For example, for some fleets the budgets are set at the plant level or by technology (coal plants separately from combined-cycle plants). Another example: Some companies budget for simple-cycle combustion turbines (peaking units) as a group, whereas large coal units are budgeted individually. The split between fuel type technologies also will impact the budgeting processes, as the average age of combined-cycle plants is much lower than that of coal plants. Consequently, each fleet’s survey responses will be reflective of the company’s budgeting policies and procedures and technology mix.
Also note that low natural gas prices in the recent past have driven down wholesale electricity prices in many regions, and gas-fired combined-cycle plants are periodically dispatched today before smaller, older, and less-efficient coal-fired plants. This unexpected inversion of the dispatch order has, in many regions, forced coal-fired assets out of their design, baseload mode and into load-following mode. Survey responses from some of these companies reflect this new market-driven operating paradigm.
Finally, it’s also not unusual to find that individual plants track and report a long list of performance measures, in stark contrast with a fleet-level focus on the critical few that promise to make the biggest impact on the company’s bottom line. Fewer tracked measures will necessarily result in fewer reported in the survey results.
As you review the survey results in the figures, remember that these results are a snapshot in time. Repeat the survey a year from now, and the fleet priority list will surely change, a few metrics will disappear, and others will be added to the list. Overall, the reported plant and fleet performance measures are best used for comparison with the metrics you currently use and perhaps to spark some ideas for other useful reporting metrics. In the end, you will need to judge if these metrics are useful within the unique operating and reporting structure of your company.
More Data Available
All the survey data in this article is in summary form. The survey database includes substantially more data, down to the individual unit reporting practices. Also note that the data presented in these two articles is not segmented by fleet size or plant size. The complete EUCG benchmarking database does contain all of that data and much more. However, the EUCG is a “give to get” organization, meaning that if you want the entire benchmarking database, you will have to not only be a member of the EUCG but must also add your survey results to the database.
Parts I and II of this three-part series relied primarily on past performance metrics—lagging indicators. Part III will examine favorite prospective or leading plant- and fleet-level indicators that are used for process improvement and compensation purposes.
— Charlene Foltzer (charlene.foltzer@pseg.com) is performance & metrics manager at PSEG Power in New Jersey and a member of the EUCG’s Fossil Productivity Committee.