In reliability engineering, few indicators are as consistently revealing as the particles that infiltrate a lubrication system. Long before vibration, temperature, or performance changes become measurable, microscopic debris begins to document the earliest stages of wear, contamination, and/or mechanical instability. For power generation assets—where turbines, hydraulic controls, gear trains, and auxiliary systems operate under demanding conditions—this particulate evidence provides some of the most actionable intelligence available for preventing unplanned downtime.
Filter debris analysis (FDA) delivers a reliable and highly informative method for revealing both the quantity and the nature of wear occurring inside critical equipment. Since it examines particles that are trapped in the filter and not suspended in the oil, it is an excellent complement to oil analysis.
Why Lubricant Debris Matters for Power Plants
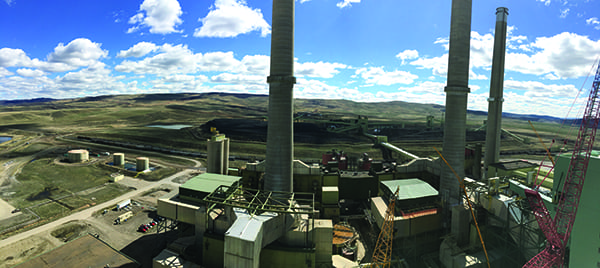
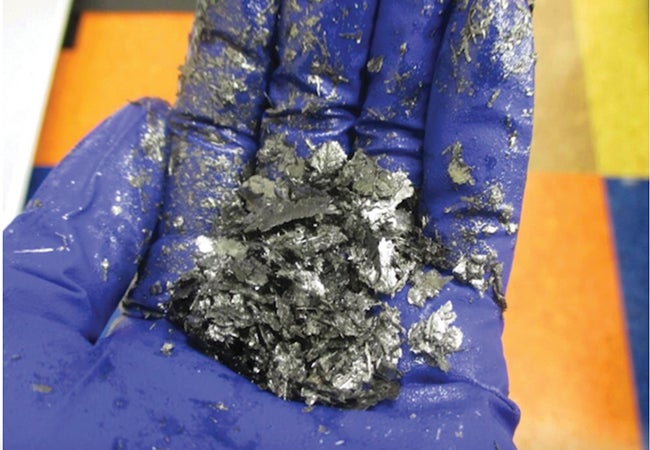
Large rotating systems in power plants—gas and steam turbines, generator bearings, hydraulic governors, and high-pressure pumps—depend on lubrication regimes that maintain film integrity, limit particulate intrusion, and manage thermal loads. However, these systems are continuously exposed to operational and environmental stressors. Even minor deviations in temperature, load, or contamination levels can initiate wear processes that steadily generate metallic and non-metallic debris (Figure 1).
 |
|
1. This photo shows debris that is typically caught in a filter and subsequently analyzed. Courtesy: Eurofins TestOil |
These particles, though microscopic, can disrupt clearances, interfere with hydrodynamic films, and accelerate surface degradation. Because today’s increasingly finer filtration captures the majority of these particles before they re-enter circulation, the oil sample often represents only a fraction of the total wear occurring within the machine. As a result, routine oil analysis may not disclose the true severity or cause of ongoing component distress.
Filter Debris Analysis: A Comprehensive Record of Wear
Filters capture the majority of wear debris in a lubricated system—often between 90% and 95%. Because of this, they retain a comprehensive record of wear events that oil samples frequently miss. FDA examines this foreign material to identify the mechanical processes responsible for its generation and to assess the severity of equipment degradation.
FDA delivers the most comprehensive view of component wear because filters capture particles that traditional oil sampling can miss. This debris found within filters often includes:
■ Ferrous and non-ferrous metallic particles from bearings, gears, journals, and thrust surfaces.
■ White metal residues from Babbitt-lined components.
■ Copper-based alloys from bushings and pads.
■ Silica and dust intrusion reflecting environmental degradation or breather failures.
■ Polymer, paint, or elastomer particles associated with seal wear or insulation breakdown.
By examining this trapped debris, engineers gain a deeper, more definitive understanding of emerging failure modes.
When Filters Should Receive Priority Analysis
While analyzing every removed filter provides the most complete data, specific operational conditions that strongly justify FDA include:
■ Unexpected increases in filter differential pressure.
■ Early filter plugging or shortened service life.
■ Elevated wear metals in oil analysis without a clear trend.
■ Vibration shifts not explained by operating conditions.
■ Hot spots or thermal anomalies near bearings or gears.
These indicators often correspond with internal wear mechanisms that do not immediately present in conventional condition monitoring data.
What Filter Debris Analysis Reveals
FDA uses elemental analysis and advanced microscopy to determine particle composition and structural characteristics. These details help identify the wear mechanism, rate of progression, and likely source.
Elemental Composition and Component Source. By correlating particle chemistry with known system materials, analysts can determine whether debris originated from:
■ Bearing races or rolling elements.
■ Thrust pads or journal surfaces.
■ Gear teeth and load-bearing edges.
■ Bushings, couplings, or linkage components.
■ External contaminants entering through breathers or seals.
This specificity provides clarity that routine oil analysis cannot achieve.
Microscopic Wear Shape/Structure. Particle shape and structure (morphology) further refine the diagnosis. For example:
■ Cutting wear indicates abrasive particulates or hard contaminants.
■ Rubbing wear suggests marginal lubrication or mixed-film operation.
■ Fatigue wear reflects subsurface crack propagation common in bearings and gears.
■ Corrosive wear reveals water or chemical contact with metal surfaces.
Morphology allows reliability teams to determine whether the wear is systemic, localized, or event-driven.
Detection of Non-Metallic Contaminants. FDA also captures foreign material that often precedes more serious wear events; this material includes fibers, degraded seal fragments, coating chips, and desiccant residue.
Detection of External Contaminants. Filters frequently capture intrusive contaminants that signal environmental or procedural issues, such as:
■ Dust, sand, or silica from air handling or seal leakage.
■ Water and corrosion byproducts.
■ Fibers, elastomers, and polymer fragments from seals or insulation.
■ Residue from previous maintenance activity.
■ Improper materials left behind during assembly or repairs.
Identifying these contaminants allows teams to trace the ingression path and prevent ongoing intrusion.
The FDA Test Procedure
FDA test systems use automated, repeatable extraction processes to ensure consistency across filters and assets. A typical workflow includes:
■ Placement of the used filter into a controlled wash chamber.
■ Automated washing using specialized fluid and compressed air to dislodge trapped debris.
■ Collection of wash liquid containing all captured inorganic particles.
■ Filtration and drying of the extracted debris.
■ Microscopy and elemental analysis to determine composition and morphology.
Because the process is standardized, data from different filters, units, or service intervals can be reliably trended.
|
Particle Count: Quantifying Lubricant Cleanliness and Stability Particle count is one of the most established tools for determining overall lubricant cleanliness. In power generation applications, the test is especially useful for verifying filter performance, monitoring the rate of ingression, and identifying early anomalies in system health. Particle count testing contributes to compliance with original equipment manufacturer (OEM)-recommended ISO 4406 cleanliness codes and identifies abnormal increases in particulate loading. There are two primary measurement approaches, each suited to specific fluid conditions. The methods are: ■ Optical Particle Counting. This method evaluates the disturbance of a laser beam as particles pass through a detection cell. The technique is precise, repeatable, and well-suited for new or lightly aged turbine oils where optical clarity is high. ■ Pore Blockage Particle Counting. For darker fluids, oils containing entrained water, or lubricants with additives that interfere with optical scattering, pore blockage provides a reliable alternative. The instrument measures flow reduction across a calibrated membrane as particles accumulate on its surface, producing a detailed particle distribution profile. |
Pairing Particle Count and FDA: A Comprehensive Diagnostic Strategy
While each test provides considerable value independently, the combined use of particle count and FDA yields a more robust, high-confidence view of system health.
When particle count increases, FDA reveals why. An elevated ISO code warrants investigation. FDA identifies whether the increase corresponds to corrosive debris, cutting wear, gearbox debris, ingression, or other mechanisms.
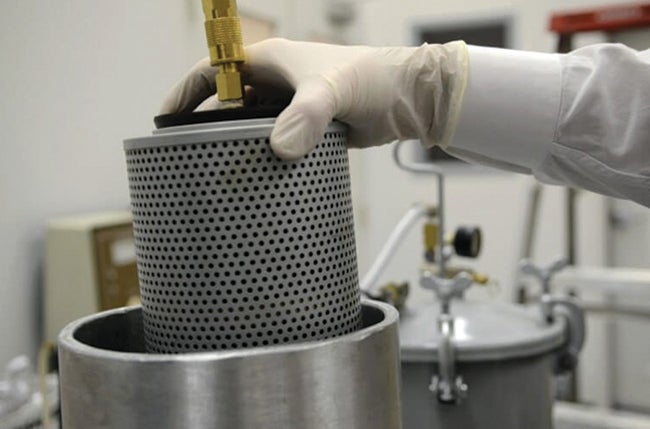
When particle count appears stable, FDA detects hidden wear. As mentioned, filters often trap the most severe wear debris before it reaches circulation (Figure 2). In fact, FDA uncovers this material even when oil samples appear nominal.
 |
|
2. A filter containing debris is prepared for analysis in the lab. Courtesy: Eurofins TestOil |
Contamination and wear rarely occur in isolation. Particle count offers rapid insight into changes in cleanliness and system behavior, while FDA reveals the deeper metallurgical and mechanical origins.
Both methods support trend analysis, allowing engineers to identify subtle increases in particulate concentration that may precede mechanical distress. Together, they form a comprehensive diagnostic framework that allows power plants to act with greater precision, confidence, and foresight.
When both methods align, decision-making becomes more reliable. Results lead to confirmation and support confident maintenance deferral, targeted inspections, and optimized downtime planning.
For power generation facilities facing aging assets, variable load profiles, and stringent availability targets, the ability to detect early mechanical deterioration before equipment is compromised is essential. For an industry where reliability directly influences production, safety, and cost, understanding the narrative captured in the smallest particles is one of the most effective strategies for preventing failures and maintaining peak performance.
—Mary Messuti is president of Eurofins TestOil, located in Strongsville, Ohio. She has more than 25 years of experience in both laboratory management as well as heavy industrial/aerospace manufacturing environments.