With low particulate loading common in stack emissions these days, particulate matter measurement can be difficult using traditional techniques. Microscopical measurement of particle-size distributions offers an alternative because it can be performed on very light sample collections, allowing particle-size determination of Environmental Protection Agency Method 5 samples that weigh as little as 0.25 milligrams.
Many stacks now have such a low particulate loading that the traditional aerodynamic methods of particle-size distribution (PSD) determination using cascade impactors or cyclones may require sampling for many hours in order to obtain sufficient material mass for accurate weighing. Even with long sampling times, total particulate collections of only a milligram (mg) are becoming common.
There are also some stack-sampling situations where cascade impactors or cyclones simply will not fit into the stack, may be degraded by high temperatures, or are rendered unusable by the presence of liquid droplets. In such cases, the determination of PSDs in the stack emissions for engineering studies or compliance tests can be more easily accomplished by sizing the particulate matter (PM) collected by traditional methods, such as the Environmental Protection Agency’s (EPA’s) Method 5 Determination of Particulate Matter Emissions from Stationary Sources. Furthermore, the difficulties that can be encountered with Method 201A—Determination of PM10 and PM2.5 Emissions from Stationary Sources (Constant Sampling Rate Procedure) have led a number of states and provinces to accept microscopy-based particle sizing in cases where Method 201A cannot be applied.
The most common analytical tool used to measure the PSD of stack samples collected on Method 5 or other filters is the scanning electron microscope (SEM). A high-quality standard SEM can be used to determine PSDs down to about 0.3 micrometers (µm), or as small as 50 nanometers (nm), if a specialized field emission scanning electron microscope is employed. Visible light microscopy may be used if the minimum particle diameter of concern is no less than 1µm, and transmission electron microscopy can be used if particle diameters less than about 50 nm (0.05µm) are of interest.
Particulate Matter Sampling Considerations
PSD measurement by SEM is most often used in conjunction with Method 5 (or 5B) samples, and sometimes with Method 17 samples. For these types of samples, the filter used in sampling determines the subsequent SEM analytical approach.
The ideal filter is polycarbonate, which comes in a variety of pore sizes. The most common pore size used in stack sampling is 0.4µm. Smaller pore sizes (0.2µm and even 0.1µm) are sometimes used.
Polycarbonate filters are preferred because they are nearly featureless. The lack of features means that automated image processing analysis tools can be used to distinguish particles from the filter background. Unfortunately, polycarbonate filters are temperature sensitive and will melt at 300F, so care must be taken to prevent overheating during collection.
Sampling flow rate can also be an important consideration for polycarbonate filters, particularly when smaller pore sizes are used, because filters can blank under heavy load. Fortunately, very light sample loadings are most appropriate for PSD measurement, and samples experiencing increasing pressure drops across the filter are already more heavily loaded than is optimal.
A rule of thumb for appropriate sample loading leads to an estimate of optimal sample collection times of about 20% of the time required to obtain a significant decrease in flow rate or increase in pressure drop across the filter. An underloaded filter is generally preferable to an overloaded filter.
In sampling situations where a polycarbonate filter cannot be used due to high temperatures, quartz fiber filters are generally best. In those cases, a more heavily loaded filter is preferred.
In such cases, a portion of the collected particles can be removed and redispersed onto a polycarbonate or similar filter. Care must be taken in this step because some components of the sample particulate may be soluble in liquids used for redispersing the sample. For example, samples with high sulfate or other salt concentrations cannot be dispersed in water because those salts will dissolve and then will not be included in the particle size measurements.
Scanning Electron Microscopy Analysis
Figure 1 shows a polycarbonate filter that has been used in a Method 5 train to collect particulate material from a power plant stack. The pores in the filter are dark and the filter surface itself is smooth and featureless. Particles on the filter are easily recognized by eye and can also be recognized by image processing algorithms.
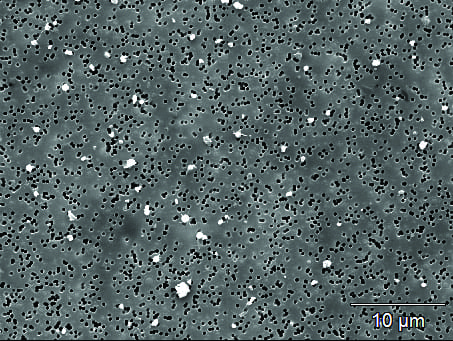 |
| 1. Particles collected are visually apparent. A secondary scanning electron microscopy (SEM) image of stack particulate matter on a polycarbonate filter is shown here. Courtesy: MVA Scientific Consultants |
Figure 2 shows stack particulate collected on a quartz glass filter. While the particles are still easily recognized by eye, the complicated structure of the filter itself will confuse image processing programs, and this particulate must be pointed out to the computer algorithm by a human analyst or removed to a more suitable substrate for image processing-based analysis.
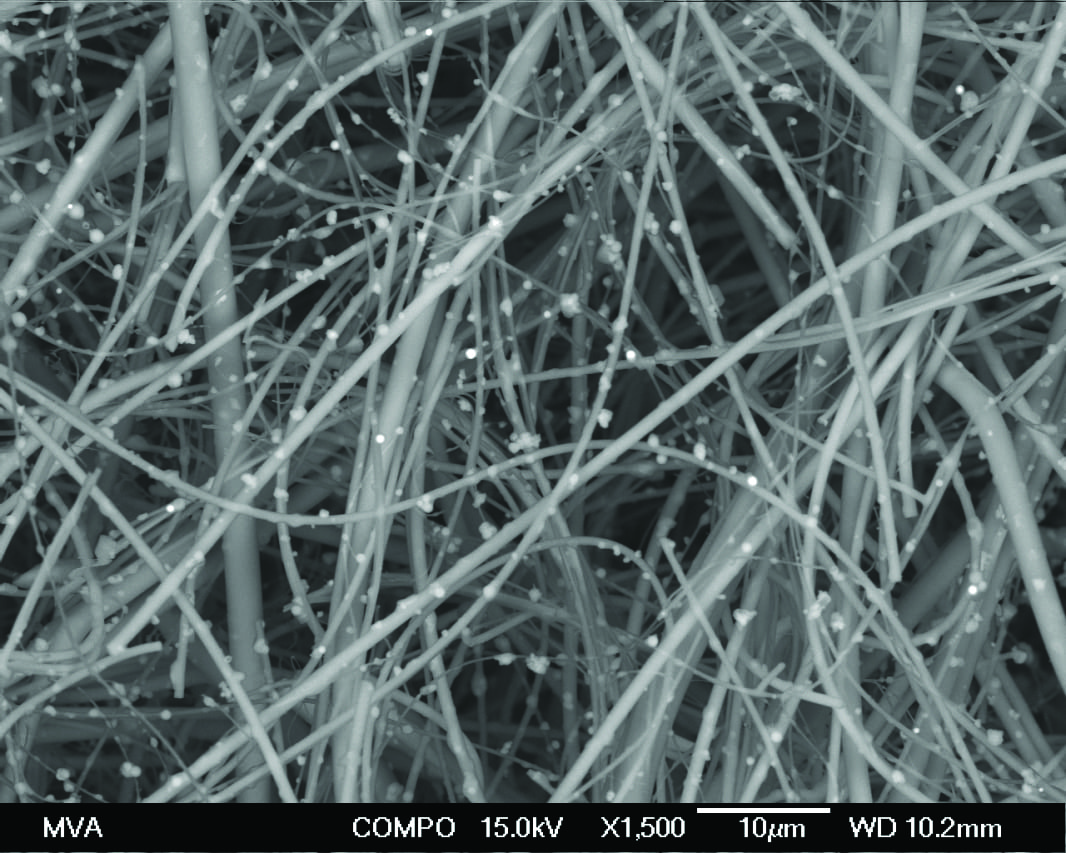 |
| 2. Fibers trap particles. This SEM image shows stack particulate matter collected on a quartz fiber filter. Courtesy: MVA Scientific Consultants |
Samples that have been collected on or redispersed onto polycarbonate or similar filters can be analyzed by automated SEM, allowing for the unattended analysis of several tens of thousands of individual particles. In MVA Scientific Consultants’ laboratory, the analysis of 20,000 particles is standard. More particles can be analyzed, if better statistics are required, especially for samples with a very low fraction of particles greater that 10µm.
For automated particle sizing, the image must contain sufficient contrast between the background and the particles so that an image analysis algorithm is capable of differentiating between them. In image analysis, a “particle” is defined as a set of contiguous pixels all of which are brighter (or more rarely, darker) than the threshold brightness used to define the surrounding “background” pixels.
Polycarbonate filters are ideal for this purpose. In Figure 1, the particles are easily recognizable as bright features; however, there is not sufficient contrast between the particles and the background for automated image analysis algorithms to accurately distinguish the particles from the filter.
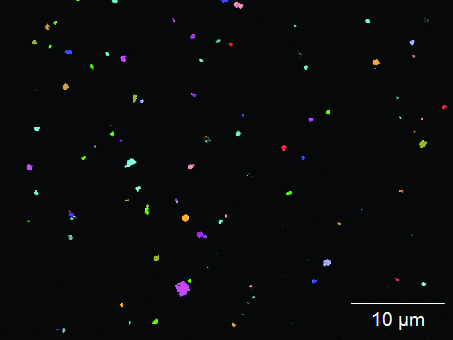
A variety of techniques are used to increase the contrast. Instrument parameters may be varied and/or different imaging modes of the microscope may be employed. The same field of view, but in backscattered electron imaging mode, is shown in Figure 3. In this mode, particles are clearly defined against the background.
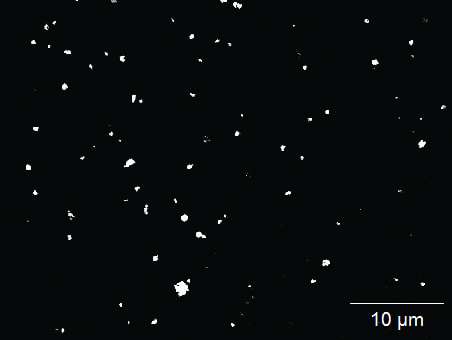 |
| 3. Visible like stars in the sky. The same particles shown in Figure 1 are shown here, but using backscattered electron imaging mode. Courtesy: MVA Scientific Consultants |
Figure 4 shows the particles that have been recognized by the image analysis system. Once the particles are recognized, automated image analysis systems can determine the average particle size, as well as any other morphological parameters that might be of interest, such as aspect ratio, circularity, and perimeter.
 |
| 4. Computer analyzed. The same particles shown in Figure 3 are shown here after recognition by the automated image analysis system algorithm. Courtesy: MVA Scientific Consultants |
In fully automated systems, the prepared filter is stepped through the field of view of the microscope until a sufficient number of particles have been identified and analyzed, which typically totals around 20,000 individual particles in MVA’s lab. Table 1 shows a sample output, listing the requested particle size and morphology parameters for the first 20 particles analyzed. The full dataset consists of similar data for all 20,000 particles.
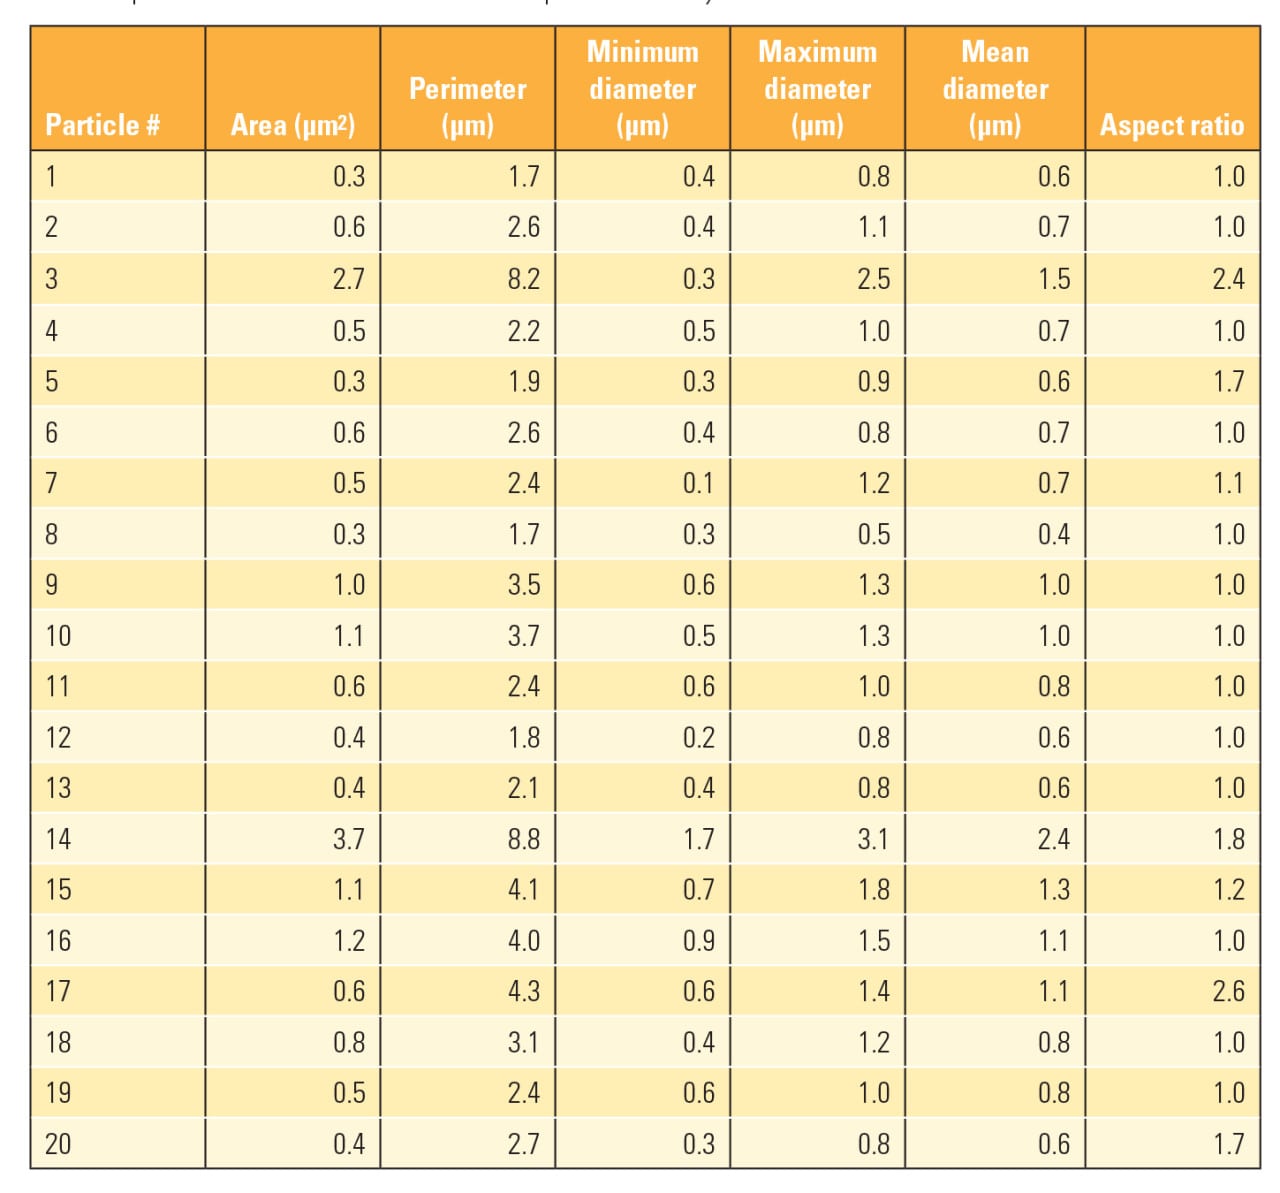 |
| Table 1. Details tell the story. This table shows a sample image analysis output for the first 20 particles examined in one example. Courtesy: MVA Scientific Consultants |
The accumulated data from the analysis of the individual particles are submitted to appropriate software for the PSD calculation and other sample parameters, as desired. Table 2 presents the PSD for the full dataset in terms of both particle number and particle mass percentages. Table 3 shows the data in terms of PM10 and PM2.5 fractions.
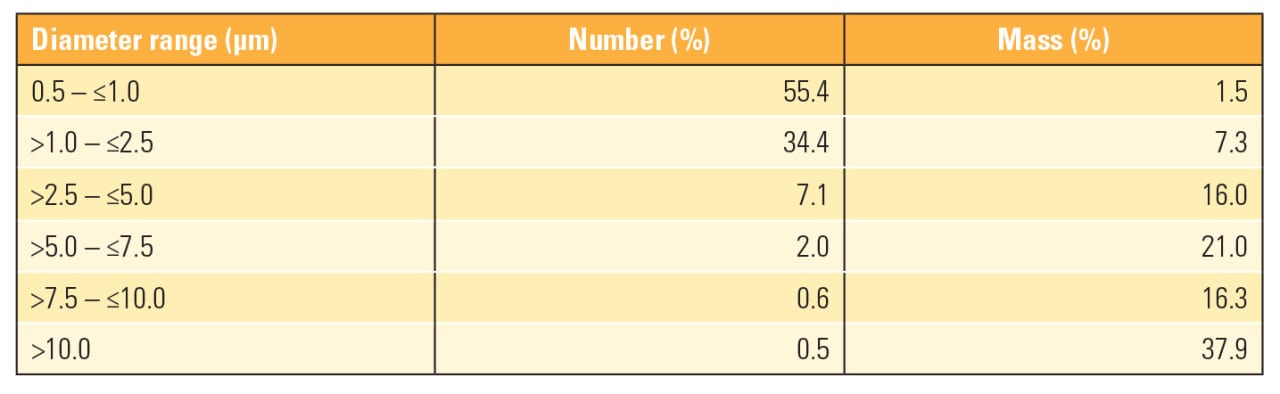 |
| Table 2. Getting the full picture. The particle size distribution data from one sample is shown here in terms of number and mass percentages. This particular sample had 19,102 particles. Courtesy: MVA Scientific Consultants |
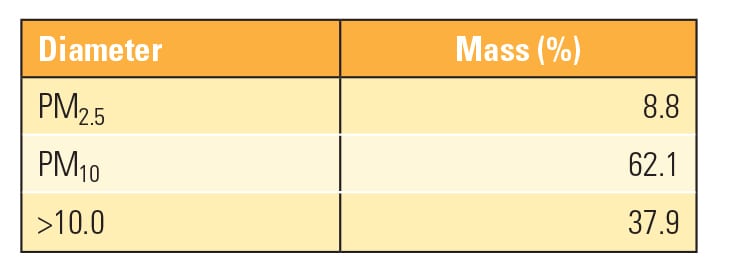 |
| Table 3. Size matters. This table breaks down the data into PM10 and PM2.5 percentages. Courtesy: MVA Scientific Consultants |
When particulate matter has been collected on quartz or glass fiber filters and cannot be removed to a different substrate, automated SEM methods cannot be used. For these samples, SEM images of the particulate (such as is shown in Figure 2) are analyzed in image processing software, but the individual particles in each image are identified by a human operator, and the measurement of individual particle sizes and any required morphological parameters is done by the image analysis software, with the parameters for each individual particle saved in a manner similar to that for fully automated analysis. In those cases, the typical number of particles analyzed is a few thousand, rather than a few tens of thousands.
Scanning Electron Microscopy Offers Options
Microscopical methods offer the ability to determine PSDs on particulate matter samples of as little as 0.25 mg of particulate collected in Method 5 (or Method 17) sample trains, allowing for significantly reduced sample collection times when compared to cascade impactor and cyclone methods of particle sizing. These methods allow for the use of completely customizable size fractions, and the reported fractions can be adjusted after sample collection.
Automated scanning electron microscopy PSD determination is based on the measurement of the physical dimensions of several tens of thousands of individual particles. For samples where fully automated analysis is not possible, several thousand individual particles are analyzed. Average diameter, volume, perimeter, aspect ratio, and other morphological parameters that may be of interest in engineering and compliance studies are recorded for each of the particles, and the appropriate particle size and/or morphology distributions are calculated. ■
—Tim B. Vander Wood, PhD (tvanderwood@mvainc.com) is executive director of MVA Scientific Consultants.