The U.S. Environmental Protection Agency has regulated particulate matter as an air pollutant for more than 40 years. Over time, PM regulations and testing methodologies have become more complex, with the focus shifting to smaller particle size fractions and the inclusion of the condensable form of PM. New developments make navigating the permitting and compliance process efficiently more important than ever.
Particulate matter (PM) is a term used to define an air pollutant that consists of a broad class of chemically and physically diverse substances that exist as discrete particles (liquid droplets or solids). PM can include a number of components such as acids (for example, nitrates and sulfates), organic chemicals, metals, and soil or dust particles.
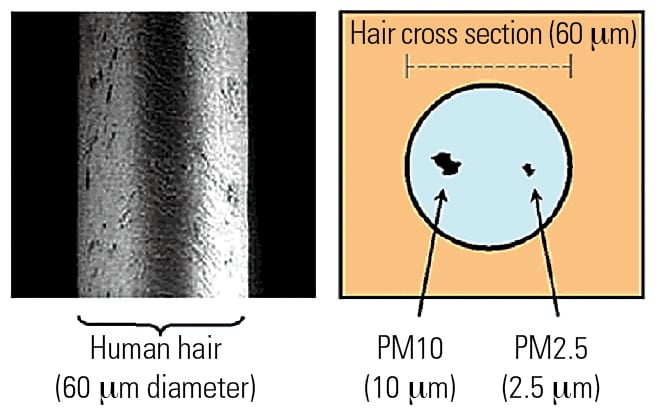
The U.S. Environmental Protection Agency (EPA) regulates “particulate matter” (originally referenced as total suspended particulate or TSP) as PM10 (particles with an aerodynamic diameter of less than or equal to 10 micrometers) and PM2.5 (particles with an aerodynamic diameter of less than or equal to 2.5 micrometers). PM10 consists of coarse and fine size fractions; PM2.5 is categorized as fine PM. Also, in some cases, the EPA regulates certain species of PM as separate air pollutants (including lead, beryllium, fluorides, and sulfuric acid).
PM may be emitted directly from a source (“primary” PM) or formed in the atmosphere as a result of complex reactions involving gaseous precursors emitted from distant sources (“secondary” PM). Gaseous precursors that contribute to the formation of secondary PM include sulfur dioxide (SO2), nitrogen oxides (NOx), and volatile organic compounds.
PM that is captured in-stack on the emission sampling equipment filter is referred to as the filterable component of primary PM emissions (“filterable” PM). Solid or liquid particles that condense from gaseous emissions within seconds of exiting a stack (at ambient conditions) are referred to as the condensable component of primary PM emissions (“condensable” PM). Condensable PM emissions can be as much as 90% of total PM (condensable plus filterable PM) emissions, depending on fuel type, emission control systems, combustion temperatures, and other source-specific conditions. All condensable PM, if emitted by a source, is in the PM2.5 size fraction; therefore, all condensable PM is a component of both primary PM2.5 and primary PM10 emissions.
The particle size category is directly linked to its potential to adversely impact human health and welfare. PM10 is small enough to easily pass through the throat and nose and enter the lungs, and it can cause serious respiratory and cardiovascular health effects; therefore, this PM size fraction is sometimes referenced as “inhalable” particulate. In addition to human health effects, fine PM is a main contributor to visibility impairment (regional haze) in many urban areas of the country.
Regulatory History of PM
The regulation of PM air pollution under the Clean Air Act (CAA) began in 1971 with the establishment of the National Ambient Air Quality Standard (NAAQS) for TSP. A summary of the most prominent regulatory milestones for the PM NAAQS and related compliance assessment procedures are shown in the table.
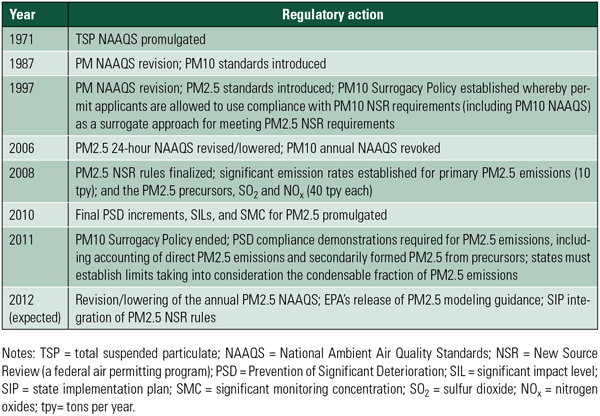 |
| Regulatory milestones for PM NAAQS and related compliance assessment requirements. Source: EPA |
Over the next 40 years, the regulatory requirements evolved to address smaller particle sizes and physical characteristics of PM. For example, condensable PM was recently included as a regulated component of PM air pollution alongside filterable PM. Moving forward, for PM10 and PM2.5, State Implementation Plans (SIPs) and regulations, General/Transportation Conformity, New Source Review (NSR, which includes both nonattainment NSR, or NNSR, and Prevention of Significant Deterioration, or PSD, review), and annual emissions statements all must address condensable PM emissions. This recent regulatory requirement, along with anticipated regulatory updates and federal guidance in 2012, creates a variety of new challenges, especially with regard to the required analyses for sources subject to NNSR and PSD review.
Evolution of PM Test Methods
Evolution of the form of the PM NAAQS over the years has necessitated periodic development of new or revised stack test reference methods (RMs) by the EPA to provide representative emissions measurements. The accuracy of measured emission rates needed for compliance assessment is highly dependent on the adequacy of the RMs. However, as described below, the measurement of condensable PM emissions continues to be a bit more problematic than the measurement of filterable PM emissions.
The history of these PM measurement methods begins in 1971 with promulgation of EPA RM 5, following on the heels of promulgation of the TSP NAAQS earlier that year. In 1978, the EPA promulgated RM 17 as an alternative method for measuring PM, where the stack gas PM concentration is known to be independent of temperature. Both RMs 5 and 17 rely on a filter media to capture PM for emissions quantification, thus measuring filterable PM.
With promulgation of the PM10 NAAQS in 1987, a new method was needed to quantify PM10 emissions specifically because RMs 5 and 17 provided a PM measurement that included all size fractions. Therefore, in April 1990, the EPA promulgated RM 201/201A as the stack test method for filterable PM10 (see 40 Code of Federal Regulations [CFR] Part 51, Appendix M).
The EPA recognized that condensable PM emissions can be a significant fraction of the actual total PM10 emissions from combustion sources that was to be measured. As a result, in December 1991, the EPA promulgated RM 202 (see 40 CFR Part 51, Appendix M). RM 202 is typically used in conjunction with RM 5 or RM 201A to measure total (filterable plus condensable) PM. The RM 202 apparatus actually is the “back half” of the RM 5 or 201A sampling equipment train.
In the originally promulgated version of RM 202, exhaust gases were bubbled through water-filled impingers, and the solution was analyzed in a laboratory to quantify the organic and inorganic PM fractions (typically, for combustion sources, the inorganic fraction predominates, with sulfates constituting most of this fraction). However, numerous studies conducted both inside and outside the EPA indicated that noncondensable gases such as SO2 could react in the water solution to form condensable PM (sulfates) that would not have otherwise formed in the stack. The formation of this sulfate artifact or “pseudo-particulate” resulted in elevated RM 202 stack test results. In some cases, when combined with the filterable PM test results, the stack test results yielded total PM10/PM2.5 emission rates that exceeded permit limits. (Note that, in many instances, permit limits were based on filterable PM10/PM2.5 emission rates only.) Thus, many sources were required to re-open permits to revise PM emission limits and/or conduct further compliance demonstrations, at significant time and cost to the permittees.
The promulgation of the more restrictive PM2.5 NAAQS in 2006, a revision of the PM2.5 NAAQS released in 1997, put increased emphasis on improving stack gas PM measurement methods for the smaller size fraction. As a result, in December 2010, the EPA promulgated revised versions of RMs 201A and 202. Changes to RM 201A required mainly hardware additions, most notably a PM2.5 cyclone and a PM2.5 filter after the PM10 cyclone to enable the measurement of filterable PM2.5, in addition to filterable PM10. RM 202 was modified to incorporate a condenser and “dry impinger” setup in the back half of the sampling train. The equipment used in this test method is illustrated in Figure 1. RM 202 sample recovery and processing procedures also were revised, mainly to incorporate existing procedures in the RM that had been optional. EPA research studies showed that these revisions to RM 202 would reduce sulfate artifact formation by at least 90% (75 FR 80118).
 |
| 1. Chemistry lesson. This illustration shows the EPA Reference Method 202 sampling components required to measure condensable PM. Source: EPA |
Despite the EPA’s recent efforts to improve the precision of RM 202, questions remain as to the ability of the method to produce representative PM measurements, especially for natural gas–fired combustion sources. This issue is critically important given the recent favoring of gas-fired combustion turbines for baseload generation and for new power plants.
Test results for natural gas–fired units indicate that nearly all of the PM (filterable and condensable) in the exhaust gas is smaller than PM2.5. Comprehensive studies cosponsored by federal and state government agencies and industry have shown that actual emissions from natural gas–fired units are extremely low, probably near ambient background concentrations of PM2.5 in many cases. Such levels are below the estimated minimum detection limits and lower quantification limits of not only RM 202, but RM 5 and RM 201A as well; therefore, total PM emission levels are difficult to quantify with any confidence.
Increasing method sampling run times to several hours (to collect more PM mass) may help to improve the representativeness of the test results; however, this is not a cure-all solution, and significant uncertainty remains with these RMs.
PM2.5 Emission Factors
Stack test results, while serving as an important means of demonstrating compliance with permit emission limits for existing sources, also form the basis of emission factors used in the permitting of new sources. As such, test results are also a key source of uncertainty in any permitting-related requirement that relies on emission factors (for example, a NAAQS compliance demonstration).
The basis for the selection of PM2.5 emission factors used by permit applicants should be thoroughly understood before proceeding with regulatory assessments involving the use of such factors. Emissions can either be based on readily available, accepted emission factor references, such as AP-42, or be based on actual stack test results for a specific type of emission source under specific operating conditions.
Caution is required when selecting emission factors from AP-42. These emission factors are based on stack test results, but those test results could be representative of either a very limited set of emission units under specific operating conditions or a very broad set of emission units under different operating conditions.
Many permit applicants that use an AP-42 emission factor do not realize that data more directly applicable to their specific emission sources and operating conditions may be available for evaluation as a more appropriate or representative emission factor. In many instances, permit applicants rely on vendor-provided (sometimes referenced as “guaranteed”) emissions data as an alternative to AP-42. Such data may be more representative of the particular emission unit proposed for a project; however, such data may not be specific enough for the operating conditions associated with the proposed unit. To the extent possible, an emissions factor should be evaluated based on actual operating parameters (such as emission controls on or off), operating modes (for example, load level and startup/shutdown), and fuel type associated with the testing program(s) that generated the emission factor.
Permit applicants should carefully select PM2.5 emission factors, particularly in light of the historic limitations of RM 202. EPA AP-42 emission factors currently are based on test results for the “old” version of RM 202; the use of such factors may yield nonrepresentative, overly conservative PM2.5 emissions estimates due to the sulfate artifact issue discussed earlier. Vendor-supplied emissions data and even emissions data based on the recently revised RM 202 may appear to be more appropriate but should still be closely scrutinized, especially data for natural gas–fired combustion units.
Once the basis for the PM2.5 emission rates is understood, complex regulatory assessments such as NSR applicability evaluation, emissions offsets quantification (for sources subject to NNSR), and a NAAQS compliance demonstration (for sources subject to PSD review) can be conducted as accurately and effectively as current understanding and technology will allow. In addition, for existing, permitted sources of PM10/PM2.5, understanding the basis for the emissions data can be important when negotiating revised permit limits that account for condensable PM emissions.
NSR Applicability Evaluations
Sources to be permitted in an area that is in attainment of the NAAQS for a particular pollutant must be evaluated in terms of potential applicability of PSD review rules for that pollutant, while sources to be permitted in an area that is in nonattainment of the NAAQS for a particular pollutant must be evaluated in terms of potential applicability of NNSR rules for that pollutant.
For a new or modified source, projected emissions are compared against regulatory threshold levels in the NNSR or PSD review rules to assess the applicability of such rules; therefore, the representativeness of emission factors (which are used to calculate emissions) can be critically important in determining when an NNSR or PSD permit is required. This is especially so for emission factors for condensable PM, which now must be included with emission factors for filterable PM in calculating PM2.5 emission rates for applicability assessments.
Both the NNSR and PSD permitting programs contain requirements for PM2.5 that may be challenging and onerous if projected emissions exceed the regulatory threshold levels. The potential ramifications of having to comply with the requirements of NNSR (emission offsets quantification) and PSD review (NAAQS compliance demonstration) are explored further in the following sections.
NNSR Requirement: Emission Offsets. Under the CAA, all major sources and major modifications at existing major sources within a nonattainment area must obtain emissions reductions to offset any emissions increases resulting from the project that are at least equal to the emissions increase. Figure 2 shows areas of the U.S. that are in nonattainment of the 24-hour PM2.5 NAAQS. Emission “offsets” are generally purchased from another industrial source in the same vicinity that has voluntarily overcontrolled emissions or shut down emission units.
 |
| 2. Few counties not in compliance. This map shows counties designated nonattainment for the PM2.5 NAAQS (1997 Standard and/or 2006 Standard). Nonattainment areas are indicated by color. When only a portion of a county is shown in color, it indicates that only that part of the county is within a nonattainment area boundary. Source: EPA |
For direct PM2.5 emissions, the EPA established that the ratio of total actual emissions reductions to the emissions increase must be at least 1:1, although a state may establish a higher offset ratio in its state program (73 FR 28321). Additionally, states may adopt NNSR rules that would allow direct PM2.5 emissions to be offset with reductions in PM2.5 precursors in accordance with offset ratios contained in an approved SIP for the applicable nonattainment area. The cost of offsetting emissions has increased with the recent requirement to account for the condensable PM component when calculating PM2.5 emissions. An overly conservative, unrepresentative PM2.5 emission rate can result in additional increased costs to obtain the required excessive number of emission offsets. With limited availability of emission offsets, project delays can result as applicants attempt to locate and negotiate the acquisition of an excessive number of offsets for a project.
Notably, the EPA will be proposing revisions to the PM2.5 NAAQS in the summer of 2012, and indications are that the EPA administrator will propose to lower the annual PM2.5 NAAQS from the current value of 15 μg/m3 to somewhere in the range of 11 to 13 μg/m3 (while most likely leaving the 24-hour NAAQS unchanged). With this tightening of the annual NAAQS, more areas of the country could be designated as PM2.5 nonattainment areas, potentially increasing the number of future permitting projects that will need to obtain emission offsets.
PSD Requirement: PM2.5 NAAQS Compliance Demonstration. For sources that trigger PSD review for PM2.5, a compliance demonstration for the PM2.5 NAAQS is required. NAAQS compliance demonstrations typically involve the estimation of ground-level concentrations (GLCs) that consist of two components:
- Calculated predictions of GLCs that are based, in part, on emission factors for the source being permitted, as well as other stationary sources in the region, which are input to computer-based air pollutant dispersion models, and
- Measured GLCs or background levels of the pollutant of interest, which are recorded by ambient monitors.
These two components—the model predictions at numerous points (that is, receptors) over a wide geographic region and the existing background pollutant level in the region—are added together and compared against the NAAQS to assess compliance at each receptor.
One of the key components of a modeling analysis is the development of an inventory of emission sources. Sources of PM have historically modeled only primary or direct PM emissions, and in recent years, primary emissions were required to include the condensable PM component in addition to the filterable PM component of emissions. Now, consideration also must be given to secondary formation of PM for NAAQS compliance demonstrations. The EPA is expected to issue PM2.5 modeling guidance in the late spring/early summer of 2012, with which it will likely provide suggestions for how to account for both primary and secondary PM2.5.
With regard to secondary PM2.5, this accounting could be of a qualitative nature, using a “weight-of-evidence” type of discussion; however, the potential dilemma for some larger combustion sources is that they could be required to conduct a quantitative analysis involving the use of complex photochemical modeling, depending on the magnitude of NOx and/or SO2emissions.
That EPA guidance also is expected to address the development of PM2.5 background concentrations. Typically, background concentrations are derived from actual monitored ambient concentrations of the pollutant(s) of interest. However, in many areas of the country that are currently in attainment of the PM2.5 NAAQS, monitoring data show background concentrations very close to the 24-hour and/or annual NAAQS; in other words, there isn’t much “buffer” available for modeled sources’ GLCs. With the inclusion of condensable PM in the sources’ primary emissions and the addition of the secondary contribution of PM2.5, NAAQS compliance demonstrations could become significantly more problematic for sources in a location where only a very small buffer is available. The buffer will be further reduced should the EPA administrator further tighten the annual PM2.5 NAAQS compliance requirements for those sources still located in attainment areas.
Those applying for a new permit will be challenged to supply the required information given the uncertainty of the qualitative versus quantitative analysis for secondary PM2.5 formation that will be required to demonstrate compliance with PM2.5 NAAQS, as well as the required background concentrations of PM2.5. Affected sources will need to work closely with their state/local regulators to develop a plan that conforms with the EPA’s new PM2.5 modeling guidance, along with a potentially more restrictive NAAQS. This burdensome process is sure to generate much discussion and debate over the coming months.
Closing Thoughts
The permitting of emission sources of PM2.5, whether located in an attainment area or a nonattainment area for PM2.5, will continue to be challenging. The key to permitting a new source will be an assessment of available emission factors to determine the representativeness of the factors based on source operating parameters, operating modes, and fuel type, especially in consideration of the documented issues with EPA RMs. The recent requirement by the EPA to account for condensable PM emissions makes it even more imperative that applicants carefully evaluate representativeness of the emissions data and, where necessary, propose alternative, more appropriate emission factors. Nonrepresentative data can have significant project-altering effects (with regard to costs and schedules) with regard to PSD and NNSR applicability analyses, the number of emission “offsets” that need to be acquired (for NNSR sources), and NAAQS compliance demonstrations (for PSD sources).
The combination of the EPA’s new modeling guidance for PM2.5 and potentially lower 24-hour PM2.5 NAAQS will further increase the complexity of NAAQS compliance demonstrations while simultaneously increasing the uncertainty of the results of such analyses. The ramification will surely be to extend the permitting process period and make it more costly. Therefore, it is imperative to evaluate projected PM2.5 emissions and potential permitting challenges early in the design phase of a project to avoid unexpected and expensive permit delays.
— Louis Corio (lcorio@zephyrenv.com) is a senior air quality scientist and Robert Newman, PE, BCEE (rnewman@zephyrenv.com) is a principal at Zephyr Environmental Corp., Columbia, Md.