Power plants are designed to operate at their highest efficiency. Once a plant goes into operation, however, real life takes over and sometimes design outcomes are not regularly realized. Improving plant performance should be every operator’s objective, and there are some very important indications that can be utilized to help steer the plant on a course to achieve design conditions.
For centuries navigators used just two basic numbers, latitude and longitude, and simple instruments—compass and sextant, sea charts and celestial tables—to find their way over land and seas. Power plant operators can navigate toward more efficient operation using some fairly basic tools, too.
Design documents, much like sea charts and celestial tables, provide fundamental plant operating information. Furthermore, five basic parameters can be utilized to “steer” the plant toward greater efficiency. The data to watch are flue gas exit temperature, feedwater flow ratio, condenser terminal temperature difference (TTD), condenser range (RNG), and tower approach (APP).
Designed for Success
Just how does a power plant come to be designed in the first place? Let’s start at the very beginning, a very good place to start, or so I hear.
First, there must be a “need.” In the case of an investor-owned utility (IOU) regulated by a public utility commission, an integrated resource plan (IRP) is maintained to prove the IOU can meet its obligation to serve. In the case of a merchant plant or independent power producer, a business plan is created on the notion that power generation is an easy and fun way to make lots of money. (I wonder how that’s been going?)
Out of the IRP comes the “concept.” It includes details such as the plant capacity, fuel type, location, cycle design, pressures and temperatures, air quality control systems, and other important aspects of the design.
Then companies begin the process of selecting the actual equipment that will be installed in the plant. Requests for proposals (RFPs) are prepared, bids are received, studies are conducted and analyzed, and finally a supplier selected.
The steam turbine generator (STG) is one of the most important equipment choices. The successful STG vendor provides a heat kit for its design including heat balances for several load points. The load points usually include a design guarantee point (there is only one); 25%, 50%, and 75% of design; maximum calculated with valves wide open (VWO); and calculated VWO with 5% overpressure. Overpressure increases the hoop and creep stresses in the piping and casings and, depending on the Larson-Miller parameters of the metallurgy, reduces the statistical longevity of the material.
The heat balance is the foundation of the power block design and contains a wealth of information useful for day-to-day operation and maintenance. With design document baselines and simple observations, five key parameters can keep the plant on its performance course.
The Heat Kit and Heat Balance
The heat kit contains information about the STG cycle’s performance. There are various correction curves for off-design pressures, temperatures, and other parameters, and several versions of the cycle heat balance. The guaranteed balance is the basis for acceptance performance tests; the others are for information only.
Shown on the cycle heat balance are the thermodynamic state points, flows, pressures, temperatures, and enthalpies. The largest input is the net energy flow across the boundary between the steam generator and the STG—a complicated value to calculate with dozens of variables to evaluate. However, with a measured circulating water flow rate, turbine cycle heat rate (TCHR) can be calculated using RNG and load. The equation is:
TCHR = [(GPM x 500 x RNG) + (kW x 3,412)] / kW
where GPM is the circulating water flow, RNG is the difference between the outlet hot-water temperature and the inlet cold-water temperature, and kW is the load, hence four variables.
Attemperation flows are not on the design balances, but must be considered during operation. The most important output is the generator output, often given in kW, or Btu/hr when multiplied by 3,412. The largest output is the heat rejected in the condenser and cooling system (Figure 1).
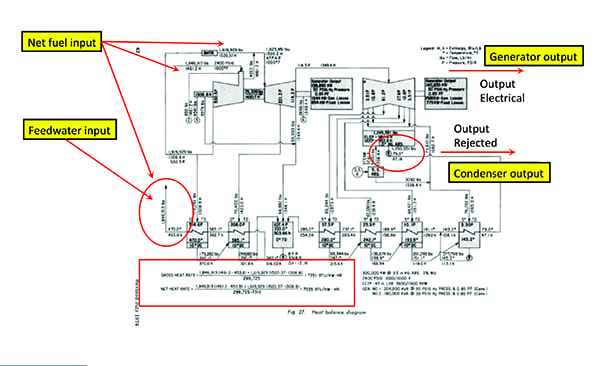 |
| 1. Heat balance diagram. The first law of thermodynamics states that energy cannot be created or destroyed, only altered in form. In other words, the “gozintaz” (energy that “goes into” the heat balance) and the “gozoutaz” (energy the “goes out” of the system) must always be equal. Courtesy: Nick Schroeder, PE |
Heat rate is an antiquated and confusing representation of cycle performance. The ratio is inverse efficiency comparing two different energy units, Btu and kWh. Plotting heat rate as a function of load creates a second order equation adding to that confusion.
The input/output ratio is a true efficiency ratio. The graphical plot is linear, Y = mx + b, with the slope, m, representing the Btu, fuel, or dollar per hour rate. Each unit will have a unique input/output line and slope representing its operating cost, $/MWh, indicating its priority of loading for economic dispatch.
The design feedwater flow ratio can be calculated across the load range, plotted, and used for reference during daily operation. As changes and adjustments are made, efficient actions/practices will reduce the ratio and inefficient actions/practices will increase the ratio. Over time, efficient actions will be identified.
Flue Gas Exit Temperatures
The amount of energy lost up the stack is a function of the amount of flue gas (FG) and its temperature. If the FG mass flow is measured by a continuous emissions monitoring system, heat loss up the stack can be calculated in Btu/hr using the FG temperature and specific heat capacity. To do so, FG Flow (lb/hr) is multiplied by specific heat capacity (Btu/lb-F) and FG temperature (F). Boiler efficiency is calculated by subtracting stack loss (Btu/hr) from fuel input (Btu/hr) and dividing the result by fuel input (Btu/hr). It’s simple to calculate and easy to trend.
Simple observations can identify operational problems. For instance, high loss on ignition (LOI), dark streaks in the furnace fireball, and suspiciously low NOx are symptomatic of tramp in-leakage. Tramp in-leakage is air entering the boiler casing, ductwork, and expansion joints after the furnace, which dilutes the FG and misleads the excess oxygen analyzers. When tramp in-leakage is present, the measured excess air and oxygen does not reflect the reducing atmosphere actually in the fireball.
The minimum flow rate is limited by safe combustion and the minimum temperature is limited by acid condensation corrosion in the ductwork and stack. Because of fuel and ambient fluctuations and steam coil air preheating, a definitive baseline exit FG temperature is difficult to calculate or predict, but reviewing acceptance performance data and trending these temperatures over time can create a baseline for reference.
Feedwater Flow Ratio
Feedwater flow ratio (lb/hr/kW) is another useful comparison. A design graph can be created, which can be compared to operating data. It can help answer the question: “Where is the plant currently operating compared to design?”
The design heat rate can be adjusted by the operating/design ratio and inserted into the heat balance equation to calculate the circulating water flow rate. What was the design? What is the current flow rate? What needs to be done about that?
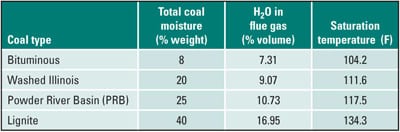
The feedwater flow (Table 1) is the centerpiece of the Rankine turbine cycle. In the traditional turbine cycle heat rate calculation, feedwater flow and its variations are the predominant factor. As a result, the feedwater flow ratio can serve as a useful proxy for the turbine cycle heat rate.
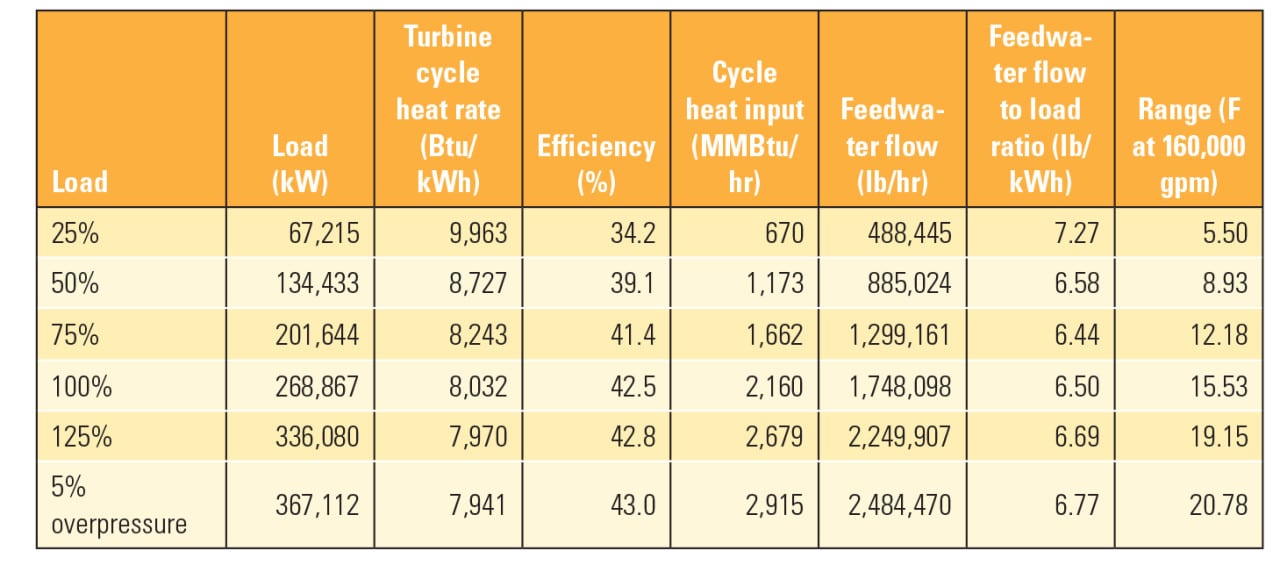 |
| Table 1. By design. This table provides an example of heat balance design values calculated at one power plant and how they vary under different load conditions. Source: Nick Schroeder, PE |
Circulating Water System
The purpose of the circulating water system is to remove the rejected heat from the condenser. The saturation temperature and corresponding backpressure (BP) is the sum result of three temperature differences: TTD, RNG, and APP.
Efficient circulating water system operation depends on the performance and interaction between the condenser, pumps, and tower. If the condenser fouls, flow will decrease, increasing RNG, raising BP, and reduced tube velocity will reduce the condenser’s basic heat transfer coefficient (see sidebar). Poor tower performance will increase the APP and raise the BP.
| Think in Absolute Terms
The large density change due to the phase change from exhaust steam to condensate is responsible for the backpressure in a condenser—the air removal system is not. Referring to this condenser condition as vacuum is confusing. Without ambient barometric pressure, vacuum has no thermodynamic value. Steam turbine generator (STG) manufacturers often specify trip and alarm setpoints based on vacuum. However, unless these values are converted into absolute pressure terms, the large amount of operating room is difficult to appreciate. For instance, an operating backpressure of 27.46 inches of mercury (in-Hg) vacuum, equates to about 2.5 in-Hg absolute. An STG’s alarm and trip points might be 20 in-Hg vacuum and 18 in-Hg vacuum, respectively. While allowing backpressure to increase in certain situations to 5 or 6 in-Hg absolute would result in a corresponding temperature increase that could kill off slime-forming bacteria, there is little danger of a turbine alarm or trip resulting from such a short-term backpressure excursion. |
The circulating water loop generally carries half of the energy that entered the turbine. For such a large heat balance component, maintaining a full-time flowmeter is well worth the investment.
To get a better understanding of the process, let’s look at the individual pieces.
Terminal Temperature Difference.TTD is the difference between the saturation temperature at the steam condenser backpressure and the hot circulating water temperature leaving the condenser. The equation that describes this heat transfer is:
Q = U x A x RNG / ln (1 + RNG / TTD)
where Q is the heat transfer rate, U is the overall heat transfer coefficient, A is the heat transfer area, RNG is the range, and TTD is the terminal temperature difference. The design U factor can be determined from the data sheet. The operating U can be calculated from the operating temperatures and circulating water flow rate.
The steam condenser is sized based on a design load point. It is just that, a point. How the condenser performs at other loads will be different. Depending on the condenser correction curves in the original equipment manufacturer’s STG heat kit, the most efficient backpressure might be higher at higher than the design point load and lower than the design backpressure at loads lower than the design load. Beware; the condenser correction curves might be based on condensate flow and not feedwater flow rate.
Using calculation procedures in Heat Exchange Institute (HEI) standards or Alstom’s booklet on condenser performance (Figure 2), predicted TTDs at operating points off design can be calculated and compared to actual values.
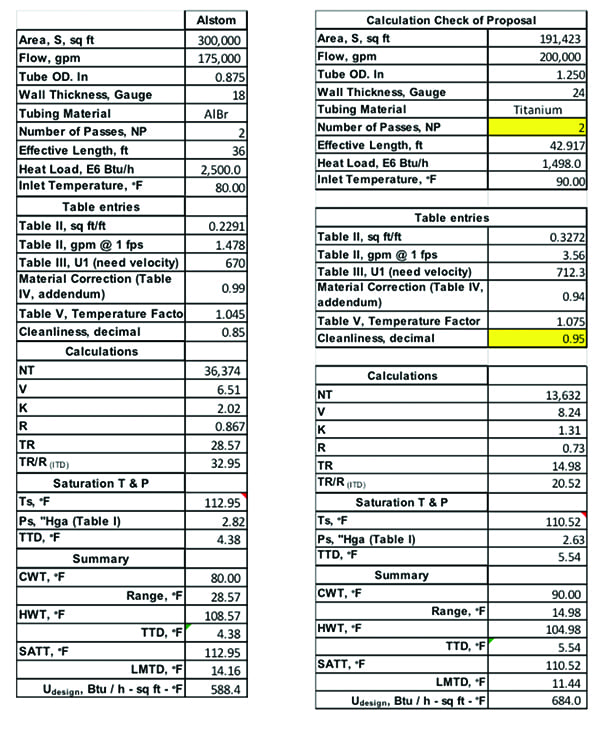 |
| 2. Calculating TTDs. This figure shows an actual example of calculations made at one plant, including terminal temperature difference (TTD). Design and operating parameters are entered to determine actual performance. Courtesy: Nick Schroeder, PE |
If the flow rate through the condenser is reduced because of fouling on the tube sheet or in the system or reduced pump output, the tube velocity will decrease as will the basic heat transfer coefficient, all adding up to increased backpressure. If the tower pump pit screens foul and the level in the tower decreases, that increases the head across the pump, which will then run back on its performance curve, reducing flow and raising backpressure.
Range. As noted previously, RNG is the difference between the outlet hot-water temperature and the inlet cold-water temperature. RNG multiplied by the water flow rate (gpm) and 500 equals the heat load (Btu/hr). If the circulating water (CW) system includes an auxiliary loop and auxiliary plate-and-frame or shell-and-tube heat exchangers, the heat load, water flow rate, and RNG will be different between the condenser and the tower.
There is sometimes a mistaken impression that the tower is responsible for the RNG. You might hear someone say, “The tower reduced the temperature by 18F.” This is incorrect. The design RNG is based on the design heat load and design water flow rate. If RNG is different from design, that is symptomatic of a few different problems. If the RNG is higher than design, it might be due to higher-than-design rejected heat load or lower-than-design circulating water flow rate.
Once again, there might be a mistaken belief that a large RNG indicates good performance. If the circulating water flow rate is known, a circulating water pump efficiency calculation can be performed. Liquid horsepower (HP) equals flow (gpm) x head (ft/3,960). Head is the difference between the pump discharge pressure corrected for elevation and the difference in elevation between the gauge and the pump basin’s surface. Motor HP can be calculated using the following equation:
Motor HP = voltage x current x √3 x name plate power factor x efficiency /.7455
The nameplate value of power factor x efficiency can be determined from the rated values. Finally, pump efficiency equals the liquid HP / motor HP x 100.
Approach. APP is the difference between the cold-water temperature leaving the cooling tower and some variation of the wet bulb temperature. Design APP is typically based on the inlet wet bulb with an additional 2F to address possible recirculation. This recirculation correction essentially increases the size of the tower in much the same way as the condenser cleanliness factor increases surface area. Recirculation might not be an issue during actual operation depending on local conditions.
For day-to-day operation an ambient wet bulb temperature is sufficient for tracking tower performance. A wet bulb psychrometer is inexpensive and can even be fabricated in many instrumentation and control shops. In some cases, a distributed control system (DCS) that monitors an onsite weather station could provide dry bulb, relative humidity, and dew point, from which wet bulb can be derived.
The tower can be modeled the same as any other heat exchanger and an equation of the form Q = U x A x LMTD developed, where LMTD is the logarithmic mean temperature difference.
The various temperatures can be plotted on a moist air psychrometric chart. Hot circulating water minus cold circulating water as the hot fluid, and the fill air exit temperature minus the ambient wet bulb temperature as the cold fluid. The hot fluid and cold fluid heat loads must be equal. The Cooling Technology Institute’s Acceptance Test Code for Water Cooling Towers (CTI ATC-105) presents the calculation procedures. The equation for the fill air exit enthalpy is:
Δh = L / G x RNG
where Δh is enthalpy change in air flow (Btu/lb), L is the mass flow of hot water, and G is the mass flow of dry air. Wet bulb inlet enthalpy plus Δh equals the fill air exit enthalpy.
ATC-105 suggests that the operating line lies on the psychrometric chart at a slope equal to the L/G ratio, for example, 45 degrees for L/G = 1.0. When the operating line is plotted in this way, it crosses the air exit enthalpy line at a temperature greater than that of the entering circulating water. This violates thermodynamic laws.
Some authors have suggested that the operating line crosses the fill air exit enthalpy line at the bulk water temperature, that is, the hot incoming water. This point would have an approach of 0F and is also unreasonable.
SPX/Marley’s “Fundamentals” reference states and shows the air exits the fill in saturated conditions. Plotting the operating line for this condition would intersect the air exit enthalpy line at the saturation line and identify an air exit temperature.
Therefore, all four temperatures are available for calculating the LMTD factor as follows:
TTD = CW inlet temperature – Air exit temperature
APP = CW outlet temperature – Wet bulb temperature
LMTD = (TTD – APP) / ln(TTD / APP)
In the cooling tower factor, KaV/L, where a is the surface area per volume of fill and V is the volume of the fill, the product of a and V is the fill surface area. K/L is the effective thermal conductivity of the fill.
The design heat load, flows, and temperatures can be used to calculate an effective design thermal conductivity. Operating data can be collected and applied to calculate an operating conductivity (Figure 3). As is the case with any heat exchanger, these conductivities can be compared to determine efficiency.
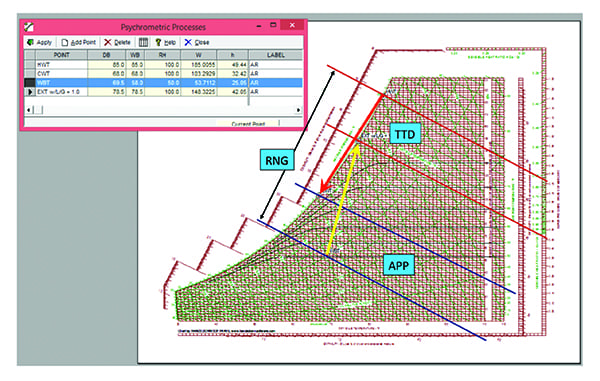 |
| 3. Psychrometric processes. A moist air psychrometric chart can be used to plot temperatures and calculate tower performance. Courtesy: Nick Schroeder, PE |
Putting Losses in Perspective
When selecting the most cost-effective targets for performance improvements, a perspective on the various losses is helpful. About 15% of fuel losses occur in the stack with about a third due to dry gas loss, about a third due to moisture, and about a third due to miscellaneous losses.
Condensing the latent heat energy in the flue gas moisture is difficult and expensive. The assorted miscellaneous losses—such as LOI, boiler skin radiation, and wet bottom hoppers—are each too small to effectively recover. Only the dry gas losses hold much potential for improvement.
Dry gas losses are due to the temperature and quantity of flue gas. The most-effective action plan is to maintain excess air as low as safely possible and keep exit flue gas temperatures as low as allowable through clean surfaces.
The steam turbine blade path is on the order of 90% efficient. Losses are due to seals and packing leakage, and blade surface conditions. There is a lower limit in the ability of seals and packing to reduce losses. Minimum clearances are required to prevent rubs. Blade surface conditions are corrected with cleaning and repairs during outage teardowns and inspections. Those schedules are becoming further apart. The potential for major performance savings in the blade path is relatively low and opportunities are limited. Retractable packing performance improvements are relatively small and difficult to measure and verify.
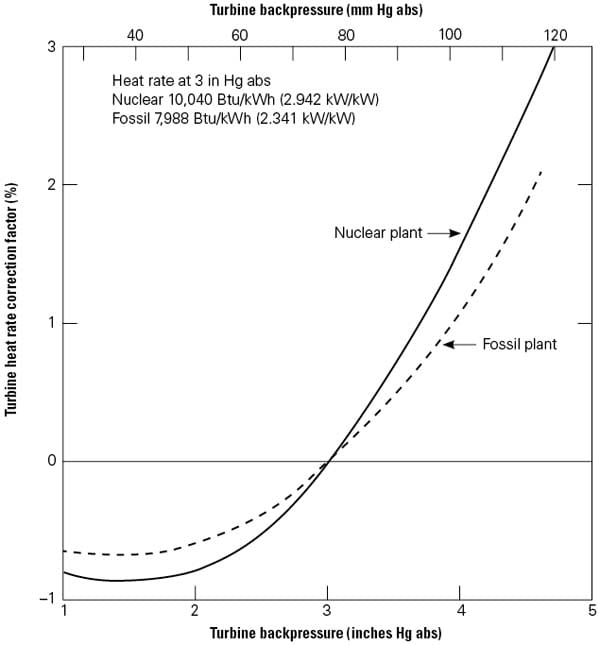
About half of the energy that enters the turbine cycle ends up as rejected heat in the condenser. The backpressure defines the lower limit of the Carnot/Rankine cycle boundaries. The greater the area enclosed by those boundaries, the greater the energy available for conversion, and for a given efficiency, more output for the given input. A 1.0-inch mercury increase in backpressure reduces the available energy and cycle output by as much as 5%.
Suppose it were possible to reduce the losses in each one of these areas by 10%. The stack loss reduction would be 0.5%. The blade path loss reduction would be 1%. The circulating water loss reduction would be 5%. For most power plants, the circulating water system, including the condenser, pumps, and tower, holds the greatest potential for performance improvements. Achieving and maintaining the most efficient backpressure holds the greatest potential for cost-effective performance improvements.
Real-time performance programs assembled in the DCS, monitored and compiled into weekly or monthly reports by engineers, and maintained by IT staff are often too detailed and complex for casual daily use, especially when higher priorities arise. Formal performance testing is still required for corporate records, economic dispatch, guarantees, and some regulatory purposes. Such formal testing requires special plant configurations and does not reflect typical daily operation. Collecting, analyzing, and reporting the data provides certain details about equipment condition for long-term outage and overhaul planning, but it’s generally not all that useful for daily operation.
The five key performance parameters presented here are simple, easy to understand, way points that can help guide daily operation, assisting operators as they navigate toward the original design performance ports. ■
—Nick Schroeder, PE, (nschroeder48@aol.com) is president of Heat Rate Navigation Services Inc. He has 40 years of experience working in the power industry.