Electricity is produced by a variety of generating units, each with different lead times and costs to be readied for service, and production costs once brought online. Because electricity is a commodity that cannot be easily stored, generation should match consumption at any given time; therefore, the cost of generating electricity has a direct relationship to electricity demand, typically referred to as electricity load.
An accurate load forecast enables generators to optimize the mix of generating units that can serve the expected load while minimizing the production costs. This holds true for generators in both regulated and deregulated markets. In several deregulated markets, the electricity market operator is in charge of dispatching the available generation units according to the market’s expected load and individual units’ offered generation costs. The units offering lower costs are dispatched first and those offering at higher prices may not be utilized.
The generation asset owners need to have an accurate forecast of the market’s expected load in order to decide the offer that maximizes the chance of their units being dispatched, while also maximizing profit. Accurate load forecasts can result in significant cost savings and profits for generation asset owners in both regulated and deregulated markets. In this article we focus on short-term hourly forecasting, which covers a forecast horizon that extends from the next hour to one week ahead.
A significant portion of the load is due to the cooling and heating of buildings, making weather the most important driver of the load. There are several weather variables that impact load, including humidity, cloud cover, and wind speed, but temperature is the primary driver.
The relationship between load and temperature is quite nonlinear and complex. This is illustrated in Figure 1, which shows the scatter plot of the hourly load of the Texas electricity market (ERCOT) for all hours of 2017 versus temperature. The shown temperature is a weighted average of 20 weather sites within Texas representing the weather regions that impact this load. The nonlinear aspect of the load-temperature relationship is evident by the U-shaped form of the plot, whereas the complexity of the relationship can be inferred by noting that many load values are associated with each individual temperature reading.
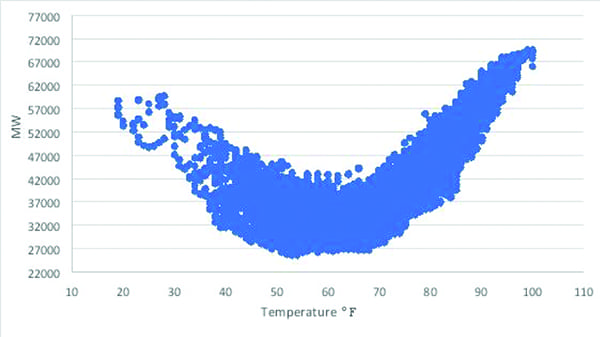 |
| 1. Nonlinear and complex. This scatter plot of the hourly load of the Texas electricity market shows the relationship of temperature to megawatts used across 2017. The nonlinear aspect is evident by the U-shaped form of the plot; complexity is inferred by noting the many load values associated with each individual temperature reading. Courtesy: Drillinginfo |
Other Factors Have Impacts
Other factors besides weather that impact load include calendar effects, such as day of the week, seasonality, or hour of the day. For instance, weekend loads are lower than weekdays. Monday loads are typically higher than other weekdays because many businesses restart their buildings’ heating, ventilation, and air conditioning (HVAC) systems that have been turned off during the weekend. Heating loads during the morning hours are higher in winter, whereas loads of summer afternoon hours are high due to cooling. The hourly actual and forecasted loads of a week in winter (February 2017) and summer (June 2017) are shown in Figure 2.
![Figure 2 - Actual and Forecasted ERCOT Loads in Summer and Winter[final]](https://www.powermag.com/wp-content/uploads/2018/06/figure-2-actual-and-forecasted-ercot-loads-in-summer-and-winterfinal.jpg) |
| 2. Summer versus winter. These charts show the accuracy of load forecasts when compared to actual loads in the ERCOT market during a week in February 2017, and a week in June 2017. Heating loads drive winter demand, with higher levels of energy use during morning hours. In summer, demand for cooling drives loads, which are higher during the afternoon. Courtesy: Drillinginfo |
The required accuracy for a load forecast varies based on the considered forecast horizon. For instance, a forecast for the next few hours should typically have an error margin below 1%, whereas the error for the next-day load forecast is expected to be in the range of 1% to 3%. Producing an accurate load forecast requires modeling the nonlinear and complex load-weather relationship as well as accounting for the other mentioned factors.
Over the years, many load-forecasting systems based on different technologies have been developed. Among those, the more recent approaches that utilize artificial intelligence (AI) and machine learning (ML) technologies have proven to be more accurate than others. Machine learning is born from the general field of pattern recognition. It provides the ability to learn and model relationships by using examples and without explicit programming.
Among AI and ML approaches, artificial neural network (ANN) technology has been the most successful methodology for load forecasting. ANNs are computer models inspired by the way the human brain is organized and functions. They are made up of a large number of interconnected elementary processing elements (neurons) that communicate with each other. While little processing is performed by each single neuron, the aggregation of their activity results in an intelligent outcome. A key feature of ANNs is that they “learn” to perform a desired task (such as forecasting) from examples. This learning takes place using special training algorithms that utilize historical data. Once trained, ANNs are able to “generalize” in the sense that they can produce good results for situations that may only broadly resemble the cases encountered during training.
Forecasting with Historical Data
An ANN-based load forecaster is developed by arranging historical data in the form of example patterns. For instance, if next-day load is to be predicted, the example patterns are formed as data pairs (outcome, factors). The outcome is the next day’s load, whereas the factors include variables that this outcome is dependent on such as the next day’s temperature forecast, day of the week designation, and season of the year. Using historical data from the past few years, hundreds of such data pairs are constructed and presented to the ANN system.
Using specialized training algorithms, the ANN automatically extracts and learns the underlying relationships that exist between the outcome and factors. Once this learning process is complete, the ANN system can be utilized as a load forecaster for the specific load it has been trained for. Although there could be future situations for which similar cases do not exist in historical data, the generalization ability of ANN enables it to handle such cases as long as the learned relationships apply to them.
Temperature is the most significant variable among the utilized factors. The prediction of a future load requires the corresponding temperature forecasts. The accuracy of weather forecasts has increased significantly in recent years due to the availability of more powerful computational resources as well as improvements in weather models. There are a variety of free sources, such as the National Oceanic and Atmospheric Administration and Weather Underground, and fee-based services for obtaining hourly weather forecasts extending to one week ahead. All these entities rely on a number of public and/or proprietary numerical weather prediction (NWP) models that are based on mathematical models of atmosphere. In most cases, the forecasts of several NWPs are combined to arrive at the final forecast. One of the main distinctions among forecasts provided by different sources is in the combination approach used to blend the NWP forecasts.
The selection of the best weather forecast source/provider to use is challenging because there is no single source that consistently does a better job than the others. A multisource approach can be used to address this challenge by adaptive blending of the forecasts of multiple sources.
Pattern Recognition Technology
Drillinginfo’s Pattern Recognition Technology (PRT) uses a multisource strategy by combining a weather site’s hourly forecasts provided by four different weather vendors. The accuracy of each vendor’s forecast is analyzed for a number of criteria, such as forecast horizon, day of the week, and season of the year, and a composite accuracy score is established for each vendor. A weighted average of these four vendors’ forecasts is then created by using the accuracy scores as the weights, that is, the forecast of the vendor with the higher score is weighted more. This blended forecast is then used as the weather forecast input for the load forecast model.
Table 1 illustrates the efficacy of this approach. The next-day hourly temperature forecasts available at 8 a.m. the day prior for four sites in major cities are considered for all days of June 2017. The mean absolute error (MAE) of the hourly forecasts for the 768 hours in this period (30 days x 24 hours/day) is computed and listed in this table for the four weather vendors as well as the above-described combination.
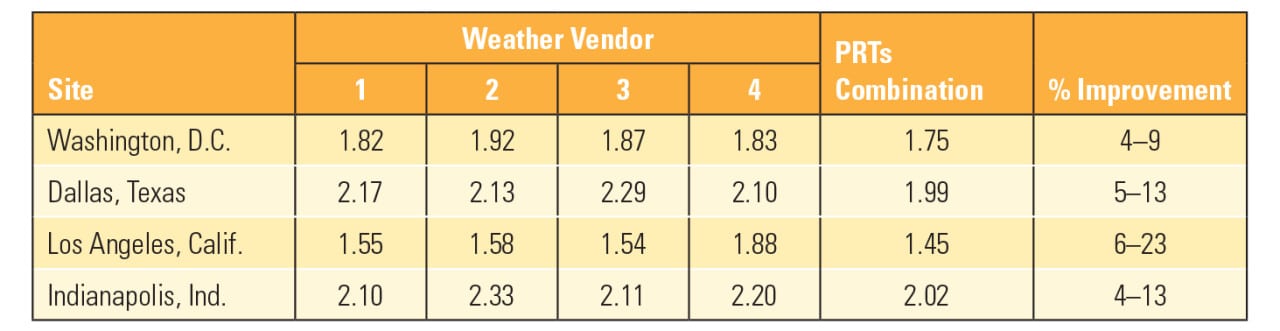 |
| Table 1. Comparing cities. Drillinginfo’s Pattern Recognition Technology (PRT) uses a multisource strategy to arrive at a load forecast, combining a weather site’s hourly forecast provided by four different vendors. This chart shows the hourly mean absolute error of next-day temperature forecasts in Fahrenheit. Accuracy is analyzed, with a composite score established for each vendor. A weighted average is created, and the blended forecast is used as the weather forecast input for the load forecast model. Source: Drillinginfo |
There is no consistency in the most accurate vendor (lowest MAE) for the four sites, whereas the combined forecast has the best accuracy. The combination approach improves the accuracy level anywhere from 4% to 23%, and as such is a viable approach for procuring weather forecasts for a load-forecasting system.
Another issue to consider is the impact of temperature forecast errors on load forecast errors. Since the load-temperature relationship is nonlinear, the relationship between these two errors is nonlinear as well. For a day when little heating or cooling is needed, a few degrees of temperature forecast error does not cause a major error in load forecast; however, on a hot or a cold day, each degree of temperature forecast error can translate to a notable load forecast error.
To illustrate this point, we consider two Mondays: one with a mild average temperature of 66F (April 24) and the other as a hot day with an average temperature of 86F (August 4). First, a load forecast is generated using the actual temperature for both Mondays. Next, load forecasts are produced by using temperature forecast scenarios created by adding biases to actual temperature ranging from±1–3 degrees, and the corresponding load forecast errors are analyzed.
The standard error metric for load forecasting is mean absolute percentage error (MAPE). It is calculated by averaging the absolute value of hourly errors expressed in percentages for all hours in the forecast period. For instance, the MAPE for a single day is the average of absolute hourly forecast errors expressed as a percentage for all 24 hours of that day. The resulting MAPEs of load forecasts using the considered temperature forecast scenarios are listed in Table 2 along with the percent increase in them as compared to the MAPE of the forecast with actual temperature. Note that the same bias in temperature results in a much higher percentage increase in MAPE for the hot Monday (August 4) as compared to the mild Monday (April 24).
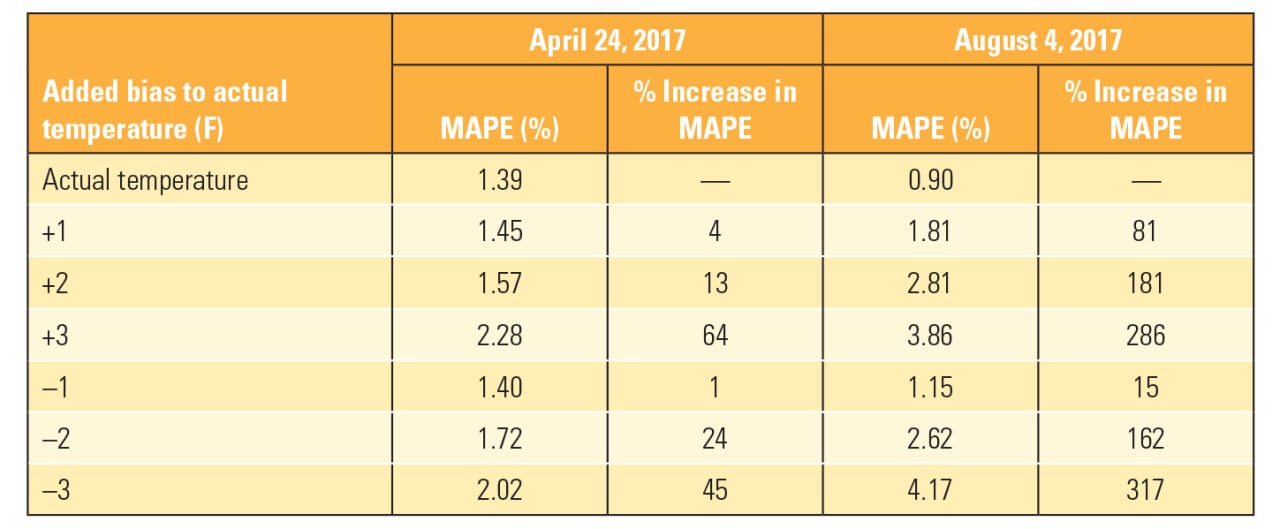 |
| Table 2. Load forecast accuracy for temperature forecast scenarios. The standard error metric for load forecasting is mean absolute percentage error (MAPE). This table notes the percentage changes in MAPE caused by differences in forecast versus actual temperatures. Source: Drillinginfo |
The focus here has been on the effect of weather on load forecasts, but the operation of a generation asset is impacted by a number of other weather-dependent factors. For instance, weather can impact the availability and price of natural gas, which are critical factors for gas-powered generators. Renewable energy resources are directly impacted by wind and cloud conditions and as such their optimal operation requires an accurate forecast of these variable weather components.
Weather clearly plays a significant role in the operational aspects of all types of electricity generation assets, and accurate weather forecasts are needed for cost-effective and efficient operation. The weather forecasting skill level has improved markedly in recent years and good-quality forecasts are now available from many public and private sources. Furthermore, a multisource approach may be used to enhance the accuracy level as well. With the availability of ever-increasing computational power, it is expected that the weather models will continue to evolve and improve resulting in more precise forecasts. ■
—Al Khotanzad is senior vice president of data sciences for Drillinginfo. He has more than 30 years of experience in the field of intelligent systems and their applications to energy-related forecasting problems.