Dispatch competition between U.S. coal and natural gas plants has been a prominent feature of power markets since 2009. The industry witnessed high coal-to-gas switching levels in 2012 as an especially warm winter pushed natural gas prices down to levels not seen in a decade. Gas prices have strengthened significantly over early 2012 levels, working to take pressure off coal plants for the upcoming year, according to a new analysis by SNL Energy.
While switching looks to remain below 2012 levels on average in 2013, significant displacement of coal volumes looks likely through the winter and spring, according to the new white paper from SNL Energy. Results from the analysis found a maximum annual average potential for 1.65 Bcf/d of incremental natural gas demand from switching in 2013 compared to 2011 levels.
Switching in 2013 looks to be front-loaded with a maximum potential of 2.83 Bcf/d on average estimated in the first half of the year, which would fall to just 0.49 Bcf/d in the second half of the year as natural gas prices draw closer to the critical $4/MMBtu level.
The rise in natural gas prices has once again made switching largely an eastern U.S. phenomenon, with displacement of coal volumes in the Midwest ISO also possible.
Development in Commodities Markets
Natural gas prices began to fall in 2011 after the summer heat subsided, a trend that strengthened in the winter and spring of 2012 as unseasonably mild weather set in across much of the country. Prices at the Henry Hub broke a key support of $2/MMBtu in early April 2012, dropping as low as $1.85/MMBtu.
A combination of switching and incremental weather-driven demand worked to drive down the natural gas storage surplus from the highs of the spring, leading to a significant price recovery, briefly topping $3.70/MMBtu at the end of November 2012.
Since that time, mild early winter weather has kept the natural gas price rally in check, with prices holding in the low to mid-$3/MMBtu range and lacking clear direction in the face of mixed weather signals.
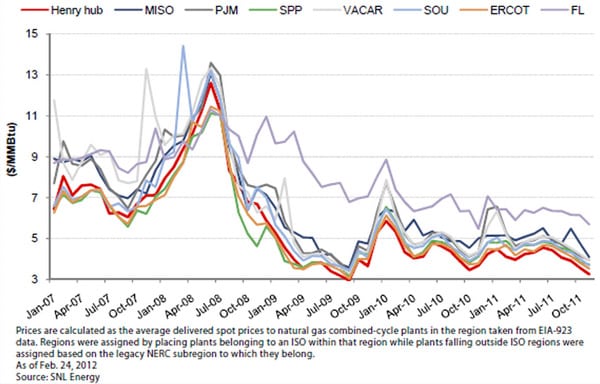
The 2013 Henry Hub forward strip has seen some weakening since the fall, when it reached $3.94/MMBtu on Oct. 1, 2012. The 2013 strip as of Dec. 27, 2012, which is used in SNL Energy’s base case study, dropped to $3.58/MMBtu, with monthly prices ranging from a low of $3.35/MMBtu for January to $3.98/MMBtu in December (Figure 1).
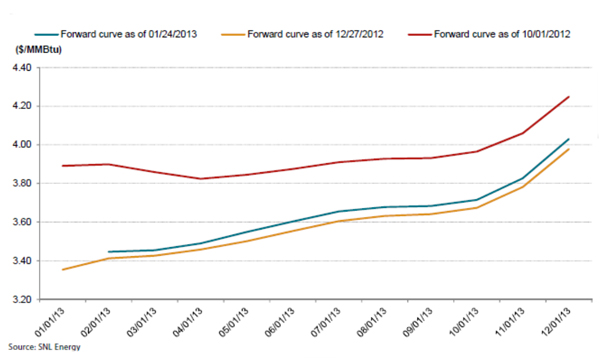
1. NYMEX Henry Hub forward curve. Courtesy: SNL Energy
Weak natural gas pricing has weighed heavily on coal markets, resulting in a combination of lower volumes and depressed prices. This eased somewhat in the fourth quarter of 2012, particularly for Powder River Basin coal, which was able to regain some market share on rising natural gas prices.
Physical market coal prices, which fell sharply in the late winter and spring of 2012, generally bottomed out in June 2012 but are discounted significantly compared to 2011 levels.
Looking forward to 2013, coal market prices are likely to remain pressured with only modest recovery, according to SNL Energy’s latest coal forecast. The Central Appalachia NYMEX-spec benchmark looks to climb 16% over the course of the year based on the forward curve as of Dec. 31, 2012. The PRB 8,800-Btu/lb product looks to rise nearly 8% in 2013, while pricing for Northern Appalachian, Illinois Basin, and western bituminous coal is expected to recover more slowly throughout 2013 as spot volumes begin to pick up (Figure 2 and 3).
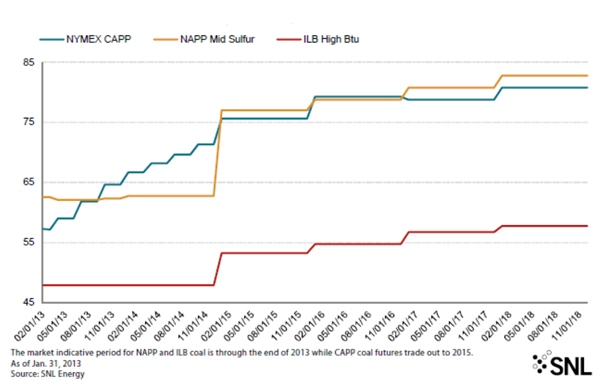
2. SNL Energy coal forecast for CAPP, NAPP, and ILB ($/ton). Courtesy: SNL Energy
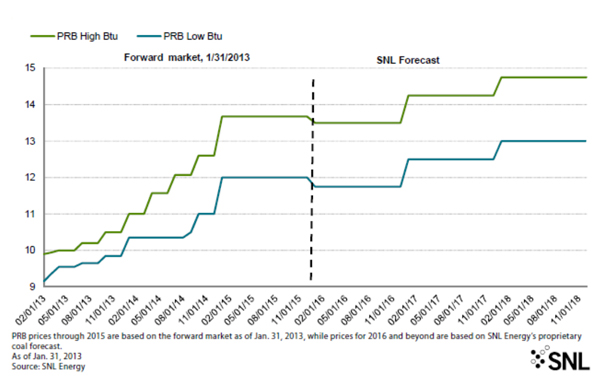
3. PRB forward prices ($/ton). Courtesy: SNL Energy
Summary of Key Model Results
In its latest coal-to-gas switching analysis, SNL Energy took a new approach using a regional hourly dispatch model to examine the potential for incremental coal-to-gas switching in 2013 compared to the base year, 2011.
SNL focused on three scenarios to estimate maximum possible incremental gas volumes resulting from switching based on ranges for forward natural gas prices in 2013. In the base case, SNL used the NYMEX forward curve for various gas hubs as of Dec. 27, 2012. A low-gas-price scenario was also examined whereby prices would be 50 cents/MMBtu below the Dec. 27 forward curve in every month of 2013 and also a high-gas-price scenario where prices were set at 50 cents/MMBtu above the base-case forward curve.
SNL Energy’s analysis found continued switching potential in the first half of 2013, with results showing significant price sensitivity within the gas price ranges considered. In the base case, maximum switching potential was found to be 2.83 Bcf/d on average in the first half of 2013, but this falls to just 0.49 Bcf/d in the second half of the year as natural gas prices draw nearer to the critical $4/MMBtu level. Average switching for the year would represent a nearly 2 Bcf/d reversal on average compared to 2012 switching levels. Average maximum switching potential in the low-gas-price case expands to 2.83 Bcf/d on average in 2013, while switching actually reverses by 0.34 Bcf/d on average in 2013 compared to 2011 levels in the high-gas-price scenario (Table 1).
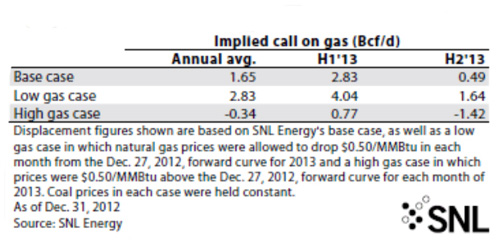
Table 1. 2013 coal-to-gas switching summary for natural gas. Courtesy: SNL Energy
On a regional basis, switching looks largely isolated to eastern U.S. markets in 2013, with some potential identified in the MISO region under SNL Energy’s base case, though this could change with a pronounced drop in natural gas prices. The PJM Interconnection LLC and the non-PJM VACAR (Virginia-Carolinas South) North American Electric Reliability Corp. subregion lead all regions, each with an average maximum call on gas of 0.42 Bcf/d resulting from displacement of coal generation. The SOU and CENTRL subregions also continue to show switching potential in 2013, with 0.31 Bcf/d and 0.14 Bcf/d, respectively, of maximum incremental gas demand identified. In every region, with the exception of VACAR, switching potential versus 2011 either reverses or falls to zero in the fourth quarter under SNL Energy’s base case (Table 2).
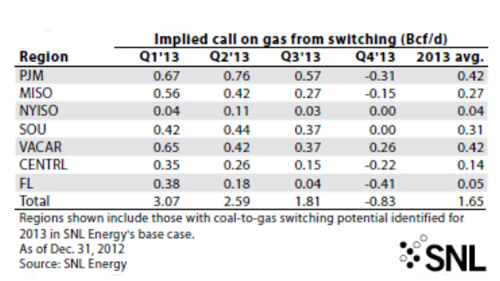
Table 2. Regional summary of natural gas results. Courtesy: SNL Energy
Total calculated maximum coal displacement versus 2011 was found to be nearly 24 million tons in SNL Energy’s base case. The bulk of this would come from Central Appalachian coal, which could see 13.7 million tons of lost volume, followed by Northern Appalachia, with nearly 5 million tons displaced. SNL Energy’s results show 3.8 million of lost tonnage from the Illinois Basin and just over 1 million tons coming from the Powder River Basin (Figure 4).
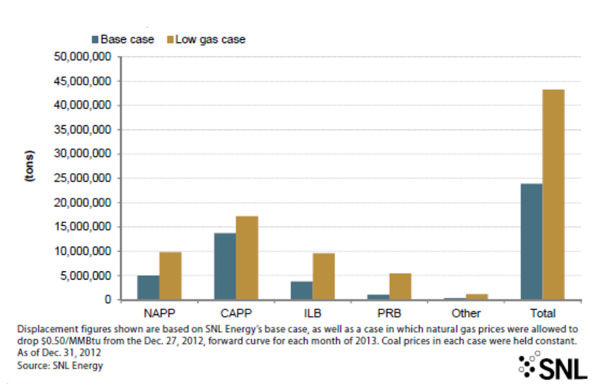
4. Potential coal displacement in 2013. Courtesy: SNL Energy
Maximum displaced coal tonnage could nearly double, to 43.3 million tons, in 2013 if natural gas prices drop 50 cents/MMBtu off the base-case natural gas forward curve, according to SNL Energy’s analysis.
—Jesse Gilbert is a senior industry analyst with SNL. This article was previously published on the SNL website. It is reprinted with permission, with minor edits for style. The full white paper, which includes an analysis of coal-to-gas switching potential across a broader range of natural gas prices, as well as a variety of other useful charts, is available here.