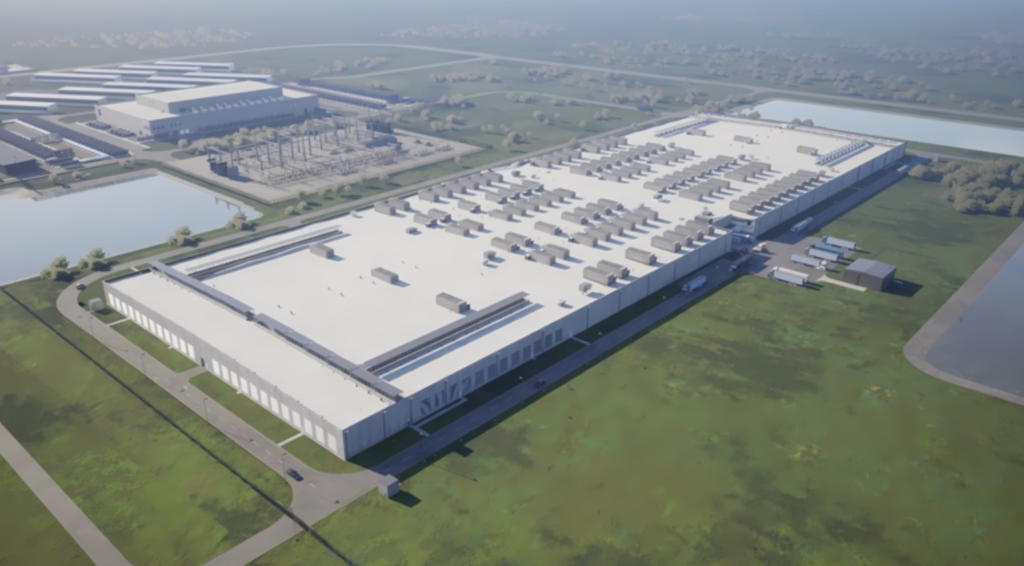
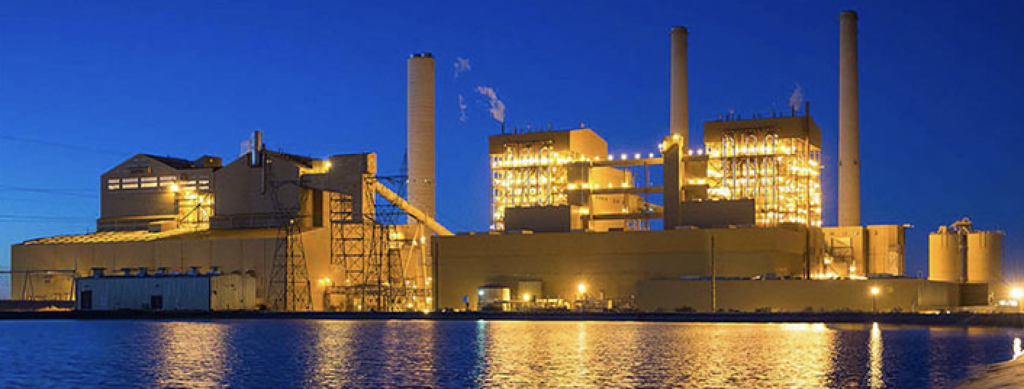
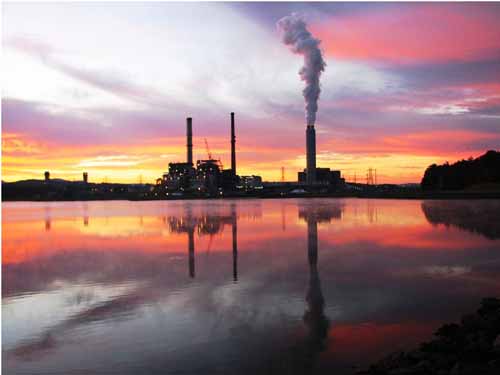
The Fayette Power Project (FPP, aka the Sam K. Seymour Power Station) is a three-unit, coal-fired generating plant sited near La Grange, Texas (Figure 1). Units 1 and 2, each with a nominal rating of 600 MW, are co-owned by the Lower Colorado River Authority (LCRA) and Austin Energy (AE). LCRA is a conservation and reclamation district that provides wholesale electricity and other services to cities and rural cooperatives in central Texas. Austin Energy is a municipal electric utility owned by the City of Austin. Unit 3, rated at 450 MW, is wholly owned by LCRA, which also manages the overall FPP facility.
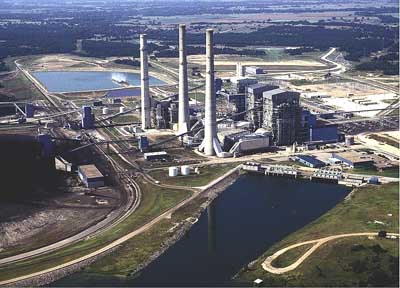
1. All three coal-fired units at LCRA’s Fayette Power Project were retrofitted with NOx-reducing combustion technology from Alstom Power. Courtesy: LCRA
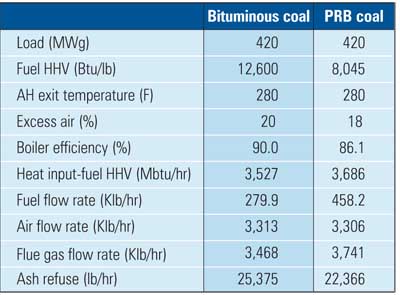
In 2000, the Texas Commission on Environmental Quality issued a rule that required all coal-fired generating units in the eastern half of the state to limit their yearly average NOx emissions to no more than 0.165 lb/mmBtu by May 2005. Based on industry experience with similarly sized tangentially fired power boilers fueled by Powder River Basin (PRB) coal, LCRA engineers determined that this level could be met at FPP by upgrading the three units’ boiler combustion systems. They chose Alstom Power Inc. to supply the upgrade packages.
Elevated Flexibility
FPP Units 1 and 2 are similar Combustion Engineering (CE) subcritical boilers, each rated for 4,199,000 lb/hr of steam flow at a superheat outlet steam pressure and temperature of 2,620 psig and 1,005F, respectively. Each boiler has a single tangentially fired, balanced-draft furnace. Originally designed to fire East Decker subbituminous coal, with provisions to fire Texas lignite in the future, the boilers now are fueled by coal from several mines in the southern Powder River Basin.
The original windbox configuration in both units had seven elevations for coal burners and two elevations for close-coupled overfire air (CCOFA) ports. Burners at the top six elevations now are used to fire PRB coal. By design, only five elevations are required to be in service to achieve rated steam flow. The unused (bottom) elevation was included in the design to accommodate future firing of lignite. On Unit 1, the original auxiliary air compartments were retrofitted with fixed concentric firing system (CFS) air nozzle tips in the fall of 1986.
FPP Unit 3, also from CE, has the same superheat steam conditions as Units 1 and 2 but it is nominally rated for 3,148,000 lb/hr of steam flow. The unit was designed to fire Texas lignite using 10 coal elevations and two CCOFA elevations. However, it has never done so and now predominately fires southern PRB coal. Nevertheless, this unique design feature allows the unit to be fed by a wide variety of mill combinations, including use of up to five spare mills. During the low-NOx retrofit, the lowest coal elevation was permanently removed from service.
Unit 1 Upgraded First
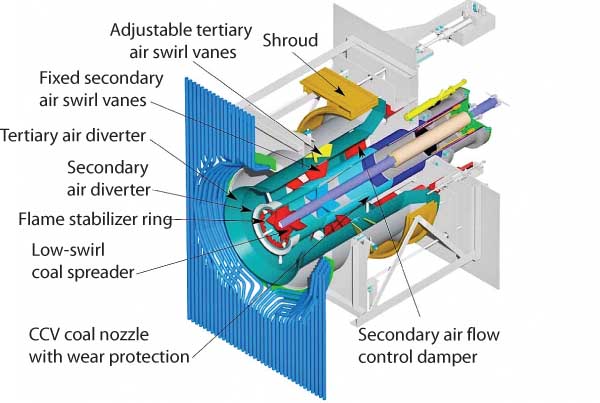
Alstom Power supplied its low-NO x Concentric Firing System (LNCFS), Level 3, for FPP Units 1 and 2 (Figure 2). For units that fire PRB coal, three major features are activated by the system to lower NO x emissions with minimal impact on boiler performance:
-
Precise furnace stoichiometry control.
-
Initial combustion process control.
-
Concentric firing via air nozzle tips.
One of the most common methods of reducing NOx emissions from a tangentially fired boiler is to use multiple levels of overfire air (OFA). OFA stages combustion by introducing some secondary air above the main firing zone in order to reduce the amount of oxygen initially available to the fuel. The LNCFS Level 3 system uses a combination of CCOFA and separated overfire air (SOFA) to achieve the precise furnace stoichiometry control necessary to reduce NOx, while simultaneously minimizing any increases in carbon monoxide (CO) and/or unburned carbon (UBC) in flyash.
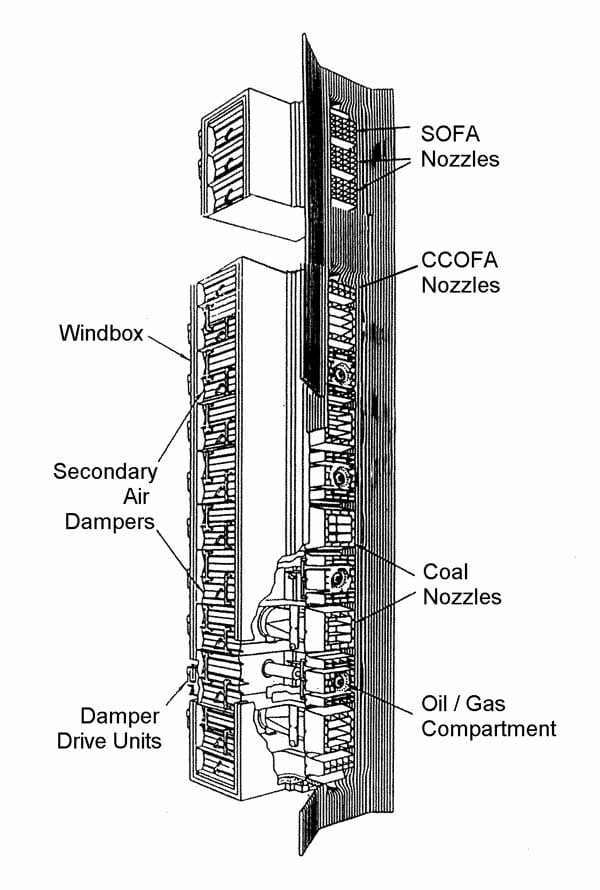
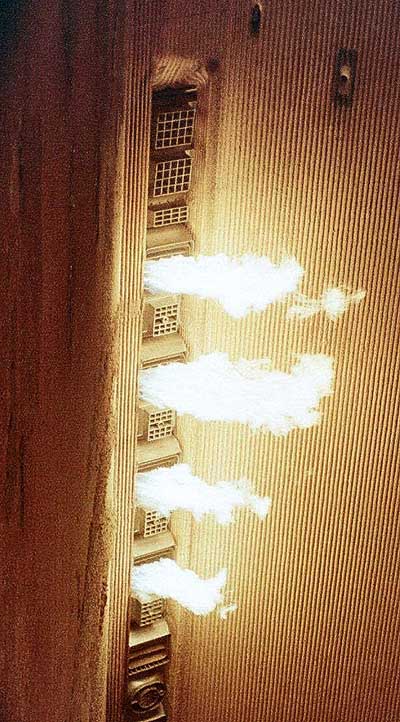
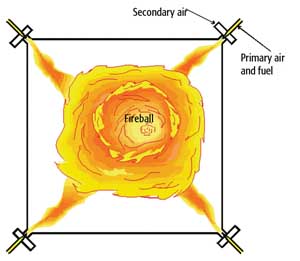
2. The upgrade required the installation of Alstom Power’s low-NOx concentric firing system (top). Shown on the bottom is the system operating with only the igniters in service. Courtesy: Alstom Power
To further minimize increases in CO, the OFA compartments can have their yaw adjusted manually. This allows each compartment to be directed to maximize mixing during the carbon burnout process. These manual adjustments are set during the tuning phase and remain in place once the optimum settings are defined. For both FPP units, the new SOFA elevations each hosts four overfire air registers located in each corner above the main windbox. Each of the registers has four compartments containing nozzle tips and individual air damper controls.
Post-outage parametric testing further characterized and optimized NOx and CO emissions, as well as the level of UBC in flyash. New control curves were developed for the SOFA dampers, and modifications were made to the existing control curves for the CCOFA and fuel air dampers, excess air damper, and windbox-to-furnace differential pressure. Final yaw settings for the SOFA, CCOFA, and CFS secondary air nozzle tips were also established. It was possible to achieve full load with five of the six mills in service.
Guarantee testing also produced excellent results. Full-load NOx emissions levels ranged from 0.117 to 0.275 lb/mmBtu, as a function of the operating conditions evaluated for various combinations of control parameters.
The retrofit package for FPP Unit 1 was installed during a planned outage covering parts of October and November 2002. The boiler then was operated for about six weeks with the final operating curves in place before guarantee testing was conducted.
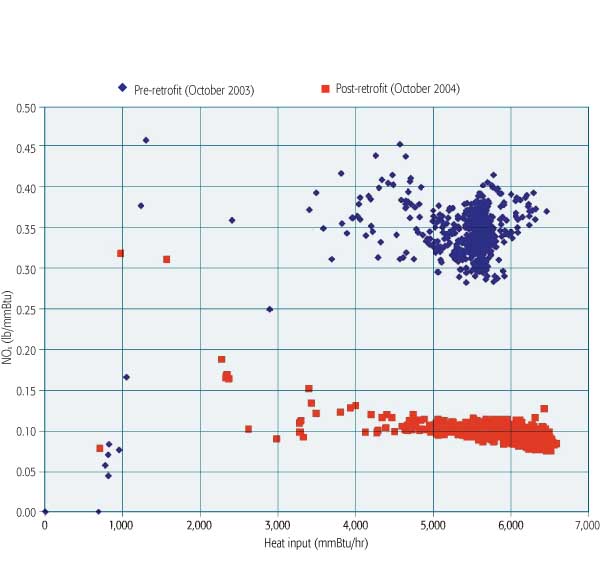
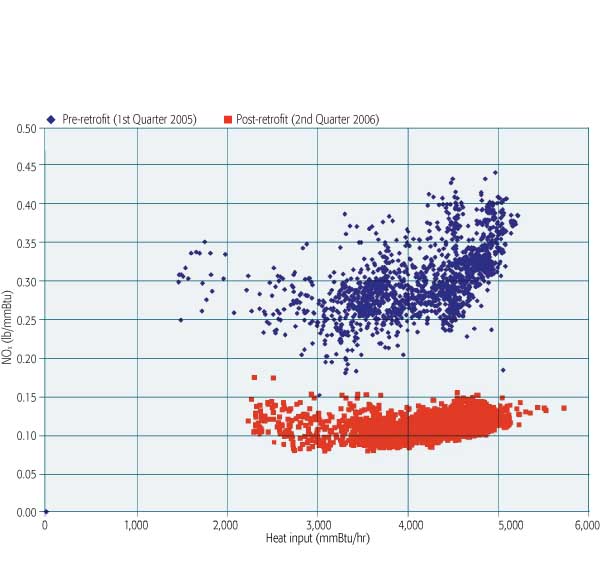
Guarantee testing also produced excellent results. Full-load NOx emissions levels ranged from 0.117 to 0.275 lb/mmBtu, as a function of the operating conditions evaluated for various combinations of control parameters. Figure 3 compares the full-load NOx levels before the retrofit with post-retrofit levels before and after tuning.

3. Unit 1’s NOx emissions before the retrofit, compared with post-retrofit levels before and after tuning. Source: LRCA
LCRA hired a third-party specialist to conduct two guarantee tests. One was done with the bottom five mills in service, and the other with the top five mills in service. Table 1 shows the post-modification guarantee test results for Unit 1, with pre-modification operating and emissions data for comparison.

Table 1. Fayette Power Project Unit 1 operating and emissions data reported by each of two tests conducted before and after combustion system modifications. Source: Alstom Power
To fine-tune the new system, LCRA and Alstom developed software routines for Unit 1’s distributed control system. The algorithms optimize furnace air distribution, furnace stoichiometry, and excess-O2 levels. They also minimize furnace temperatures based on sensor readings. For example, eight analyzers located in the boiler ductwork between the economizer section and the air preheater measure excess-O2 levels. Because the analyzers are located after a split in the flue gas ductwork, each of the two ducts houses four analyzers. The software averages the measurements from each group of analyzers and uses the lower of the two average values for control purposes.
Following the retrofit, Unit 1’s average monthly NOx emissions usually decreased from month to month during 2003 and flattened out in March 2004. From March 2003 to March 2004, they averaged 0.12 lb/mmBtu. From January 2004 through August 2004, they averaged less than 0.10 lb/mmBtu. The month with the lowest average NOx emissions was May 2004: 0.096 lb/mmBtu.
NOx emissions increased slightly beginning in September 2004, and LCRA attributed the effect to the dispatching of Unit 1 at lower loads. Until then, tuning efforts had focused exclusively on full-load operation. Subsequent efforts then centered on tuning at lower loads as well as continuing the fine-tuning at high loads by further optimizing O2, damper curves, and overfire air yaw positions.
Unit 2 Retrofit a Repeat Performance
During the initial tuning of Unit 1, LCRA and Alstom engineers developed control curves for it and Unit 2 in tandem. The curves became the starting point for tuning Unit 2. During Unit 2 tuning, full-load NOx levels ranged from 0.103 to 0.147 lb/mmBtu. The same third-party testing company again conducted two guarantee tests for Unit 2, with the top and bottom five mills in service (Table 2).
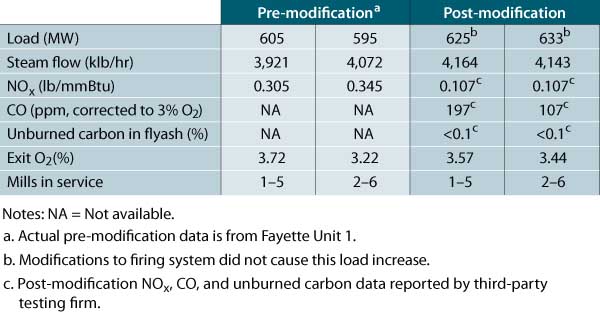
Table 2. Fayette Power Project Unit 2 operating and emissions data reported by each of two test conducted before and after combustion system modifications. Source: Alstom Power
The retrofit package for Unit 2 was installed during a planned outage covering parts of March and April 2004. After the unit was returned to service in May 2004, it was tuned through June, prior to the performance tests, which were conducted in July. Then, FPP personnel began fine-tuning Unit 2 across its load range. Between July 2004 and December 2004, NOx emissions averaged 0.102 lb/mmBtu. As was the case for Unit 1, Unit 2’s lowest monthly average NOx emission level was 0.096 lb/mmBtu, in October 2004. Performance since has been consistent with the test data (Figure 4).
4. Unit 2’s NOx emissions before and after the retrofit. Source: LCRA
Unit 3: Variations on a Tune
During Unit 3 tuning, full-load NOx levels ranged from 0.096 to 0.140 lb/mmBtu. A series of performance guarantee tests were performed on Unit 3. Because this unit was equipped with many spare mills (only four of its nine mills are required for full load), boiler performance varied significantly with the different residence times and burner tilt requirements. Table 3 compares the operating and emissions data taken with two different sets of four mills in service. Note that the reported post-modification NOx number for the Nos. 2, 4, 6, and 8 mill combination is slightly higher than for the other combination due to an increase in main tilt position.
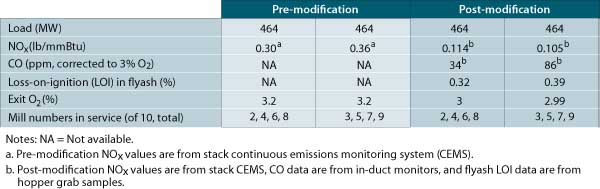
Table 3. Fayette Power Project Unit 3 operating and emissions data reported by each of two tests conducted before and after combustion system modifications. Source: Alstom Power
The retrofit package for Unit 3 was installed during a planned outage covering parts of March and April 2005. The unit was returned to service at the end of April, and engineers began fine-tuning it the following month. However, further tuning was postponed until the fall so one of the corner tilts could be repaired. Tuning resumed in October of 2005, and the performance tests were conducted the next month. Although Unit 3 is different than Units 1 and 2, the knowledge gained from the earlier retrofits accelerated its tuning. NOx emissions reported during the acceptance tests averaged 0.110 lb/mmBtu. Again, Unit 3’s lowest average monthly NOx emissions level was 0.096 lb/mmBtu, in September 2006 (Figure 5).
5. Unit 3’s NOx emissions before and after the retrofit. Source: LCRA
Figure 6 summarizes the quarterly NOx emissions data that Fayette Power Project reported to the U.S. Environmental Protection Agency from 1Q, 1997 through 4Q, 2006. The three steep drops in emissions levels, which coincide with completions of retrofits, demonstrate visually how successful the projects were.
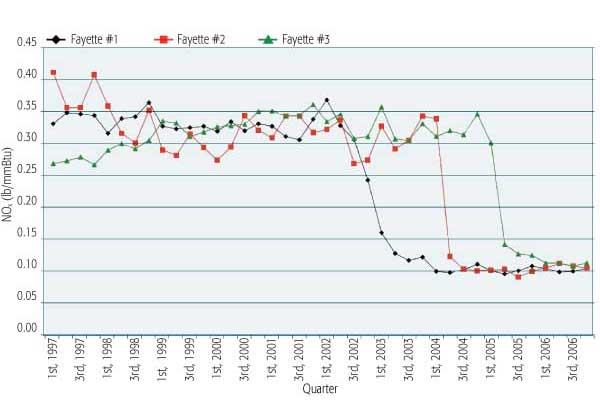
6. The Fayette Power Project’s average monthly NOx emissions over the past decade, as reported to the U.S. Environmental Protection Agency. The timing of the retrofit of each of the three units is obvious. Source: LCRA