Everyone loves to be identified as a top performer. In power generation, our plants strive for increased availability and reduced forced outages. We measure performance indicators (metrics), report them to the Generating Availability Data System (GADS), and benchmark ourselves against similarly designed power plants. And just when we think we are sitting pretty, we deal with new performance indicators such as Equivalent Forced Outage Rate–Demand (EFORd), which measures forced outage for power demand periods, not just a 24-hour clock.
However, any metric by itself has limited value. We have all witnessed organizations that correlate metrics directly to actual performance. We have also seen these same metrics manipulated to achieve the appearance of performance, such as when you try to hold on a few days to convert what would be a forced outage to a maintenance outage. Although the performance penalty is less, it still results in no generation of power.
Ultimately, plant availability is the final measure of all activities within the power plant: operations, engineering, maintenance, capital projects, etc. We tend to forget that the principal purpose of metrics is to track performance trends, and to measure the performance and/or progress of our solutions to problems. The key performance indicators we select should be exactly what we are asking of our employees and help us focus on the right things as we strive to achieve our organizational goals. Metrics can help us identify performance gaps and close these gaps leading to improved performance.
Be Careful What You Ask For…
Speaking about what we ask of our employees, one of my co-workers has a favorite saying that I wish more companies would take to heart: “Be careful what you ask for—you just might get it.” This message reminds us that our employees will typically give us what they think we expect of them. The written and unwritten priorities and measure established by management will determine our employees’ behaviors.
As an example, a question I like to ask employees when I am assessing conditions at a client site is, “Would your supervisor (or any manager) stop you from working if you were doing something unsafe?” The answer speaks volumes about the organization. “Talking the talk” for safety is not enough. If we send the verbal or non-verbal message that production, production, production, is the most important thing, our employees will respond accordingly. This message often results in shortcuts and unsafe situations. By contrast, when management actually “walks the walk” for safety, we normally see a corresponding shift in an employee’s behavior.
When we ask our people for zero safety incidents (sometimes providing them with monetary rewards such as gain share) do we mean we want to achieve zero incidents or zero reported incidents? Are we achieving fewer lost workday incidents through peer pressure and asking our people to tough it out, or through a solid program? While we might have great safety numbers, are we truly achieving our goal of keeping our people safe? The principle of demonstrating and communicating a genuine expectation for behavior applies when you are setting standards for any goal, not just safety.
Ineffectiveness in Action
Let’s examine how this applies to power plant behaviors and take a deeper look at the measurement of availability. In some plants I have observed, the measurement of availability is the pressured reason why everything needs to happen “right now!” This interpretation of improved availability can produce some unwanted secondary effects.
One of the main factors that contribute to improving availability is unplanned equipment failures. If we reduce unplanned equipment failures, we can improve availability. So, should we have several maintenance technicians placed in hot standby with tools at the ready in case the equipment goes down so they can rapidly get it back up again? Should these technicians also have a crash cart loaded up with as many parts as they can carry so they do not have to go to the storeroom to get parts? Should we not perform that critical preventive maintenance task because we are too busy responding to emergencies? NO!
While we may think we have achieved our availability targets, what have we sacrificed? Was it our improved equipment reliability that improved our availability metric or was it our improved firefighting efficiencies? Our availability numbers this month are up but so are maintenance labor costs and parts expenses. Did we rush the repair only to have it fail again next month? Are we too busy to record parts information and wonder why we never seem to have the right parts in the storeroom? Will our skipping of preventive maintenance tasks cause degraded equipment performance or future failures? I guess we can deal with that later, since that is not what our manager expects of us. As is the case with most of the above decisions, this is a typical “pay me now or pay me later” situation.
Choosing the Right Metrics to Measure
We can choose to measure hundreds of metrics. When choosing metrics, I think it’s helpful to use an image of a ladder. Before we climb our ladder, we must know where we are climbing. What is our vision for the future? What is our strategy for achieving our vision? What are the processes we need to use to reach our goals? How will I know when I have reached the desired destination or know that we are not slipping from where we need to be?
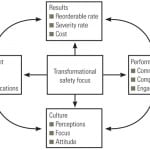
Creating strategies and processes is a very involved discussion that is too lengthy for this article. However, when we create processes to reach our destination, then the critical success factors for each process will help determine our key performance indicators. For example, if we were to take one of the processes based on the Reliability Excellence model shown in Figure 1, one of the key performance indicators would be mean time between failure (MTBF) for critical equipment supporting generation.
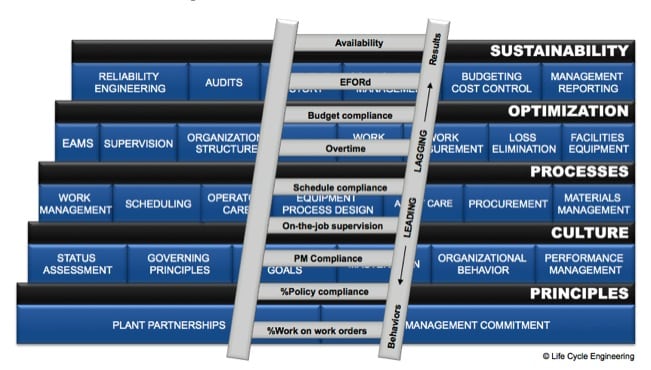
Figure 1
Effective metrics are the result of a combination of leading and lagging indicators derived from the processes you established to take you to your destination. It is not the individual metric but the combination of metrics that makes them both powerful and effective.
It is also important that all metrics have an owner—someone that is accountable for managing and reporting on what that metric represents in terms of progress toward a goal or target.
Build Your Metrics Ladder
When pictorially displayed, the metrics form a ladder with the leading indicators at the bottom and the lagging indicators at the top (Figure 1). The most leading of indicators are those that reflect our behaviors.
Leading and lagging metrics depend upon your starting point. While schedule compliance may be a leading indicator compared to availability, it is a lagging indicator compared to something as simple as measuring whether people write work orders when they see a problem.
The previously mentioned method of apparently achieving our goal through manhandling of metrics is similar to climbing a ladder with many missing rungs. You can try jumping a few rungs but you might find yourself hanging on for dear life and possibly slipping back down to where you started. For those of you that have never missed a ladder rung and fallen back down, trust me, it hurts.
We cannot overcome our poor reliability decisions by increasing our reactive efficiency. We must create a ladder with a sufficient number of rungs and we must use every rung of our ladder. Being somewhat afraid of heights and tall unstable ladders, what do we do if we have a real tall building to climb? We might consider approaching our goal in stages. We can represent this approach as stacked buildings with consecutive ladders used to reach milestones towards our ultimate goal.
When developing metrics, we must not only understand where we are going but also where we are starting. PM compliance and schedule compliance are leading indicators of a solid reliability program. However, how leading are they if you struggle with getting all work performed by maintenance on a work order or if you are finding it difficult to get operators to report problems early enough to be planned and scheduled in the first place.
Availability is a good lagging measurement (results) and is near the top of our ladder while PM and schedule compliance are more leading and are closer to the bottom. Even closer to the bottom of our ladder are behavior-based metrics such as:
- Percent of operators following established procedures
- Compliance to scheduled operations and maintenance activities
- Percent of worker PM improvement feedback that gets incorporated.
- Percent of compliance to all policies
- On-the-job supervision
- Percent of work inspected/validated
Summary
Implementing the wrong performance measurements can result in undesired behaviors and substandard performance. People compensated for the results of their metrics will achieve those results even if their actions are counterproductive to the overall goals of the company.
All metrics should have an owner. Having a large wall of metrics with the hopes that somebody will pay attention is a strategy waiting for failure. Start building your ladder with the behaviors that will support achieving your goals. Building your ladder(s) with the sufficient number of rungs will provide you the stable foothold you need to achieve your desired results.
—Dave Berube is a principal consultant for Life Cycle Engineering (LCE) and has more than 25 years of experience in leadership, management, and organizational transformation.