Readers of GAS POWER are probably aware that, since the late 1990s, there has been a fundamental shift in the U.S. natural gas market: Power generation has gradually replaced industrial use as the largest consuming sector. Ammonia and methanol industries reacted to the rising price of gas in the early 2000s by shutting down and/or moving their operations overseas while power generators increased their use of gas despite rising prices, primarily to meet increasing demand but also at the expense of coal and petroleum. The share of gas in power generation increased from 15% in 1998 to 31% in 2012 while coal’s share declined from 52% to 37%.
With the increased availability of shale gas, the issue today is that the price of gas is too low (at <$4) for sustainability of supply, although the low price has been fueling demand growth, which, of course, can push prices higher. The power sector is particularly important in creating enough demand for gas while we wait for industrial load to come back and for transportation sector use to start having a noticeable impact. Exporting liquefied natural gas is another demand driver, but the timing and volume of exports are highly uncertain, with no exports expected before 2016.
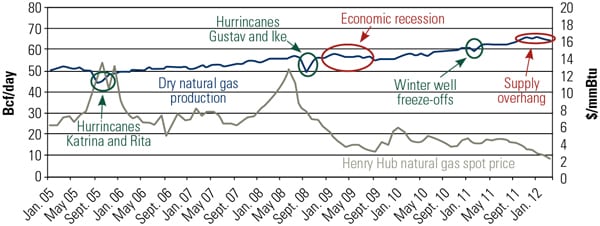
There are many factors that can impact gas use in power generation positively or negatively with uncertain ranges (Figure 1). Gas demand in the power sector is more variable than industrial demand for gas both intraday and seasonally. The integration of intermittent wind forces many gas plants (and some coal plants) to cycle to accommodate wind generation during off-peak hours; for example, in the Electricity Reliability Council of Texas (ERCOT) region, 5 GW to 7 GW of gas and coal capacity combined can be turned down to accommodate wind in early morning hours as of March 2013. The addition of large-scale solar systems and smart grid technologies, especially when combined with demand response (DR), will increase the amount of data system operators will have to manage and add to their struggle to manage increasingly dynamic electricity flows reliably. To the extent DR occurs during peak hours, the need for gas-fired peakers will be reduced.

1. A variety of factors have the potential to impact gas use for power generation. Bars on the right indicate increased demand; bars on the left indicate decreases. Bars are not to scale. Courtesy: Center for Energy Economics (CEE-BEG)
More immediately, a plethora of existing, new, and pending environmental regulations at the state and federal levels impact generation fuel portfolios. Many of these regulations increase the cost of operating coal plants, some of which may retire rather than install pollution control equipment, especially if the price of gas, and by extension, the price of electricity, stays “low.” Coal retirement estimates vary widely from several GW to 80 GW by 2020. Announced retirements exceed 30 GW, with the U.S. Energy Information Administration (EIA) reporting 8 GW of retirements in 2012. Many are older units that might have retired regardless, but the low gas price and threat of new regulations are making decisions easier.
Damage to Japan’s Fukushima Daiichi nuclear power complex in March 2011 led to cancellation of some nuclear projects such as NRG plans to expand the South Texas facility. However, the real issue is the high capital cost, which cannot be reliably recovered in competitive markets, especially when the gas price is low. Recently, Duke Energy decided to retire the Crystal River nuclear plant in Florida rather than pay $1.5 billion to repair it. Dominion plans to retire the Kewaunee nuclear power station in Wisconsin after failing to sell it. Others, such as the San Onofre plant in California, may follow suit. The replacement of this baseload capacity will likely be gas-fired capacity, with the possible exception of Vogtle plant in Georgia and others that can be built under a regulated rate base.
Shale gas production has significantly increased over the last decade and is primarily responsible for the low price of gas today. But, our analysis shows that the price of gas may need to be $6/MMBtu or higher to justify many projects, especially when drilling targets “dry” gas locations (Figure 2). The economics of producing “wet” and associated gas are better, depending upon location and as long as oil and liquids prices remain robust. The preliminary review of 2012 performance indicates that costs increased slightly for a variety of reasons, including the expense of shifting portfolios to highly competitive liquids plays in order to offset low gas prices, interest on debt (many producers continue to borrow to fund drilling and operations), and reductions in gas production.
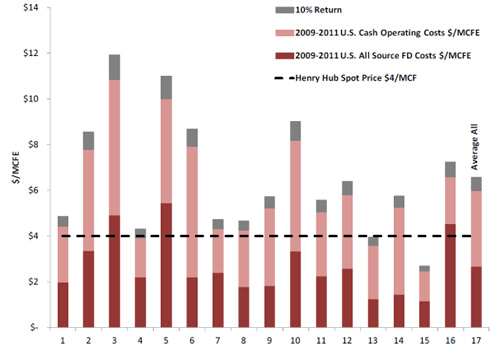
2. A sample of full-cycle production costs for 16 producers shows most need prices above $6/MMBtu to break even. Source: Monitoring U.S./Global Oil and Gas: Upstream Attainment, Producer Challenges; Courtesy: CEE-BEG
Given average producer full-cycle, breakeven cost structure, lower gas production volumes imply higher unit costs (for those companies that remain deeply invested in dry gas acreage). For our sample, gas production decreased about 1%; this is consistent with production declines for a larger sample of 40 producers (about half of U.S. domestic dry gas output). Accordingly, we believe that total U.S. dry gas production dropped around 1%. We believe that certain areas will show much larger production declines (Gulf of Mexico Outer Continental Shelf: -20%; coal-bed methane: -9%; Barnett: -1%; conventional fields: -8%). We estimate 15% growth, on average, from other U.S. shale plays, with the largest growth registered in the Marcellus (about 92% year on year, with Pennsylvania reported production of more than 2 Tcf). With the sharp drop in drilling in dry gas locations and inability for producers to hedge at prices above $4, we expect further production declines in 2013.
Finally, reported operating margins for many companies diminished but remain widely variable as the industry continues to deal with an array of factors across different basins, locations, and plays that impact performance. Throughout 2012, companies adjusted booked reserves with write-downs or write-offs related to gas price effects, sales of properties, and so on. Companies that were able to successfully shift capital expenditures to liquids posted net reserve additions of gas associated with oil and natural gas liquids. In this dynamic environment, the deliverability of gas in a timely and cost-efficient manner is a challenge; the need for new infrastructure (gathering, processing, liquids handling, pipeline transportation, storage) is large.
Even with $6 gas, high-efficiency combined cycle generators would result in electricity costs of $48/MWh, which would be competitive with many coal plants given moderate to high emissions costs. This means that older plants would have to invest in emission control equipment. There are, however, coal plants with the necessary emission control equipment and access to high-Btu coal that can supply electricity at or below $40/MWh. The staying power of coal can be seen in Europe despite greenhouse gas (GHG) cap and trade because gas prices, typically linked to oil prices, remain high.
Also worth following closely is the emergence of environmental regulations related to hydraulic fracturing, water use, and recycling of wastewater that are critical for sustained production of shale gas. Fugitive methane emissions along the natural gas supply chain are under analysis, and their regulation can potentially have significant impact on cost of gas delivery.
Finally, what are the prospects for growth in electric power demand? Retail sales of electricity sagged as the 2008-2009 crisis took hold. Demand for electric power has recovered somewhat, but slow economic recovery and high efficiency targets cloud the outlook with significant regional differences.
Impact of New Emissions Regulations
Using AURORAxmp, an electricity market modeling software, the Center for Energy Economics (CEE) at the University of Texas evaluated the impact of the Cross-State Air Pollution Rule (CSAPR), and Mercury and Air Toxics Standards (MATS). Although currently there is no federal law on limiting GHGs, some form of GHG control at the federal level is possible within the time frame of our study. Already, states are pursuing their own restrictions. We tried to capture this “threat” of GHG regulation via a CO2 tax ($14/ton in 2018 to $40/ton in 2030). The implementation of CSAPR was supposed to start in 2012, but a federal court temporarily blocked it on December 30, 2011. Until CSAPR’s fate is resolved, the Environmental Protection Agency (EPA) will implement the Clean Air Interstate Rule, somewhat less aggressive than CSAPR on reducing SO2 and NOX emissions.
We also investigated what would happen if licenses of existing nuclear facilities are not renewed at their date of expiration. In a world of “cheap” gas, increasing renewables, high capital cost with little certainty, and post-Fukushima caution, gradual and even early retirement of nuclear plants seems possible.
Finally, we replace the smooth upward forecast of the EIA with a price trajectory developed from other CEE work (Figure 3). The historical pattern of price cycles is expected to return, with an initial increase from the current levels to $7/MMBtu, adjusted for inflation, by the middle of this decade.
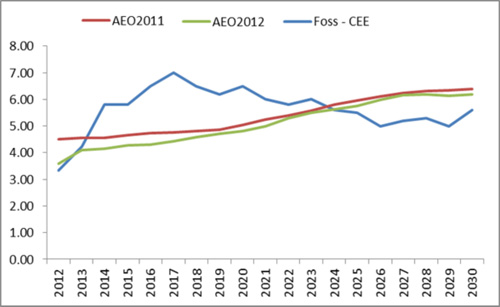
3. Projections by the CEE show higher natural gas prices in the short term than the EIA estimates, but lower prices in the long term. Source: The Outlook for U.S. Gas Prices to 2020: Henry Hub at $3 or $10?; Courtesy: CEE-BEG
Our analysis of emissions regulations results in about 40 GW of capacity retirements (almost all coal) by 2020, consistent with current predictions. New builds are mostly gas. Renewables capacity additions (mostly wind) remain limited at 18.4 GW between 2012 and 2030, despite carbon pricing and a $15/MWh subsidy; without carbon pricing only 1.7 GW of wind will be added. As a result, there is significant potential for increased gas consumption in the power sector: about 4 Tcf of additional demand in 2030 in Eastern Interconnect (EI) and ERCOT (Figure 4). Switching from the EIA gas price forecast to our price trajectory has the potential to add about 1.3 Tcf, since the price is expected to be lower in outer years of our time frame. In contrast, coal fuel use will decline less, as the price is expected to be higher in earlier years. If nuclear licenses are not renewed, close to 54 GW of nuclear capacity will retire between 2012 and 2030 and be replaced by gas-fired units, which will add another 2.8 Tcf to gas demand.
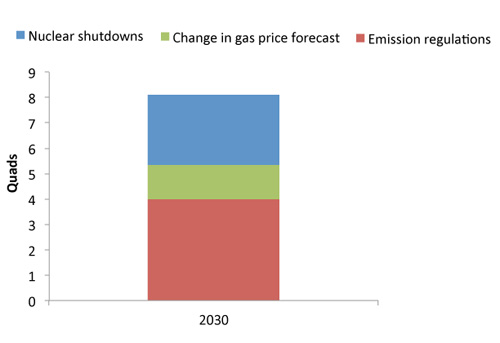
4. Gas use for power generation in EI and ERCOT could be as much as 8 Tcf higher by 2030 as a result of several factors increasing demand. Source: U.S. Gas-Power Linkages: Building Future Views; Courtesy: CEE-BEG
Impact of CREZ
We are also interested in the impact of renewables on gas use in power generation; hence, we wanted to see the impact of wind in ERCOT.
The rapid wind expansion in Texas was based on the state’s mandates but would not have occurred at the rate it did in the absence of federal production tax credits, high-quality resources, and high gas prices (see Lessons Learned from Renewable Energy Credit (REC) Trading in Texas (2009), CEE project report to State Energy Conservation Office). Because most of the wind capacity was built in West Texas, away from major load centers, new transmission lines were needed. The Public Utility Commission of Texas decided to encourage the construction of the optimal facilities with the competitive renewable energy zones (CREZ) program. The CREZ lines are now under construction and designed to have a capacity of 18 GW. When we added CREZ capacity into our simulation, it did not lead to any additional investment in wind but instead eliminated the need for new wind capacity in the Houston zone. However, when we increased incentives from $15/MWh to $25/MWh for wind and $35/MWh for solar, we observed increased renewables capacity. The increased subsidies reduced the new gas builds by about 3 GW.
Resource Adequacy in Texas
The competitive electricity market in ERCOT is an energy-only market. In recent years, especially after the summer of 2011, a concern has emerged that generation capacity expansion would not keep up with demand growth in the future. This concern is heightened by pending emissions regulations, low gas price, and integration of renewables, which sometimes bid negative prices to get dispatched. Although ERCOT routinely predicts a decline in reserve margin (primarily because only new resources with interconnection agreements and air permits are included and high demand growth assumptions are used in its assessments), the reserve margin mostly stayed above the target of 13.75% until 2011 and 2012. The impact of various assumptions on expected reserve margins can be seen in alternative scenarios put forward in 2012 (Figure 5).
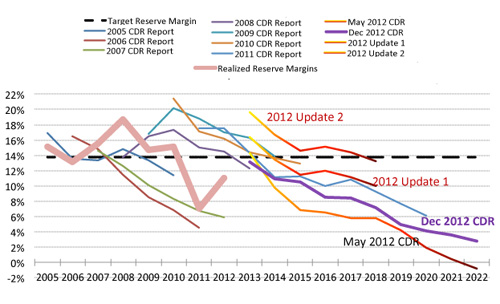
5. Forecasts of ERCOT reserve margins have shown a consistent downward trend in recent years. Source: The Outlook for U.S. Gas Prices to 2020: Henry Hub at $3 or $10?; Courtesy: CEE-BEG
To improve the price signal from the market, the systemwide offer cap was raised to $4,500/MWh (from $3,000) on August 1, 2012; it will increase to $9,000 by 2015. We tested impacts of these price caps. On average, the reserve margin will be highest under the $9,000 price cap but still lower than the 13.75% target over the 2013–2027 period: 12.8%, 12.4%, and 11.4% for $9,000, $4,500, and $3,000, respectively. The average nominal price is roughly the same for all three scenarios: In real terms, prices are greater than average prices since 2009 but similar to prices seen before 2009 because they reflect an increase in gas price from its lows in 2009–2012. Curtailment is highest with the $3,000 cap and increases over time while it is low and fairly stable with the $9,000 cap. When we use the CEE gas price forecast, reserve margins improve slightly for all cases but remain lower than the target. Higher gas price in early years of our projections lead to slightly higher average nominal prices but also to more wind builds earlier. Overall, though, we can expect to see fewer new builds and fewer retirements between 2013 and 2027.
New emissions regulations and improvements in the cost of renewables will complicate these calculations further. We are now evaluating the impact of these developments on resource adequacy in Texas. Stay tuned!
—Dr. Gülen is senior energy economist, Dr. Foss is head and chief energy economist, and Michael Soni is energy analyst at The Center for Energy Economics, Bureau of Economic Geology, at the University of Texas at Austin. David Bellman is the founder of All Energy Consulting in Columbus, Ohio. This article is adapted from a presentation at the 2013 Gas-Electric Partnership annual meeting.