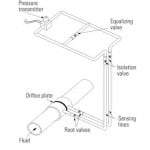
Nuclear power plants measure the dynamic response of their safety-related pressure, level, and flow transmitters for one or more of at least four reasons:
- To comply with a plant’s technical specifications and/or regulatory requirements regarding response-time testing.
- In troubleshooting, to identify sensor or sensing-line problems, including blockages, voids, and leaks.
- To manage component aging, estimate residual life, and assess the reliability of pressure-sensing systems.
- To establish objective sensor replacement schedules.
Why nuclear plants measure the dynamic response of pressure sensors and their associated sensing lines is better understood than how to do the measuring. To address that problem, this article explains a noise analysis technique that will accurately measure these dynamic responses.
The noise analysis technique provides a passive method for dynamically testing pressure-sensing systems. It generates the response time for both a pressure transmitter and its sensing lines simultaneously. The test can be performed remotely while a plant is operating, does not require that transmitters be removed from service, does not interfere with plant operation, and can be performed on several transmitters simultaneously. Those benefits result in an attractive bottom line, because tests that can be run without interrupting the demand for high nuclear plant capacity factors are a big plus in today’s competitive markets.
Basic definitions
The noise analysis technique is based on analyzing the natural fluctuations that exist at the output of pressure transmitters while a plant is operating. These fluctuations (noise) are caused by the turbulence induced by the flow of water in the system, by vibration, and by other naturally occurring phenomena.
The noise analysis test has three steps: data acquisition, data qualification, and data analysis.
Data acquisition. A pressure transmitter’s normal output is a DC signal on which the process noise (AC signal) is superimposed. That noise is extracted from the transmitter output by removing the signal’s DC component and amplifying the AC component. This is easily accomplished by using commercial signal-conditioning equipment, including amplifiers, filters, and other components. The AC signal is then digitized using a high sampling rate (1 or 2 kHz) and stored for subsequent analysis. The analysis may be performed in real time as data are collected or off-line by retrieving the data from storage.
Figure 1 illustrates a 50-second record of noise data from a pressure transmitter in a nuclear power plant. For each transmitter (or each group of transmitters), about an hour of such noise data is typically recorded for use in the analysis.
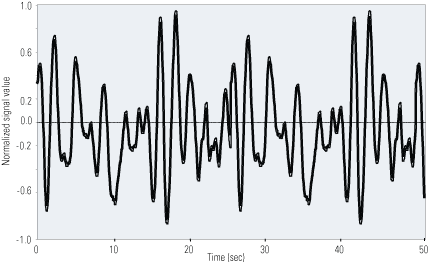
1. Collect the data. A short noise data record from a pressure transmitter in an operating nuclear power plant. Source: AMS and Springer-Verlag
Data qualification. The raw data must first be thoroughly scanned and screened before any analysis can begin. This is normally accomplished using data qualification algorithms embedded in software, which check for the stationary and linear attributes of the raw data and look for other abnormalities.
For example, the raw data’s amplitude probability density (APD) is plotted and examined for skewness. The top APD in Figure 2 is perfectly symmetrical about the mean value of the data and fits the Gaussian distribution (the bell-shaped curve) that is superimposed on the APD. A Gaussian distribution is also referred to as a normal distribution. A skewed APD (see the lower plot of Figure 2) could be caused by any number of anomalies in the data, including the nonlinearity of the sensor from which the data are retrieved.
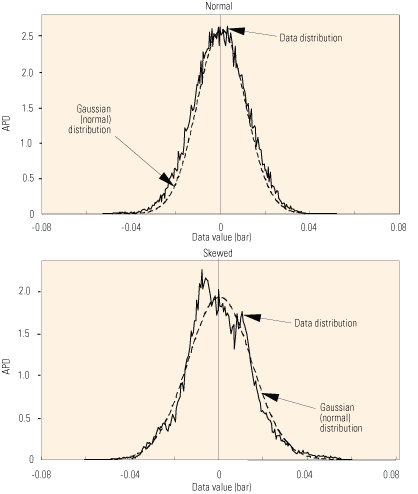
2. Manipulate the data. Normal and skewed APDs of noise signals from nuclear plant pressure transmitters. Source: AMS and Springer-Verlag
In addition to APD for noise data qualification, the mean, variance, skewness, and flatness of each block of raw data are calculated and scanned to verify that no saturated blocks, extraneous effects, missing data, or other undesirable characteristics are present. Any data block that has an anomaly is removed from the record before it is analyzed.
Data analysis. Noise data are analyzed in the frequency domain and/or time domain. For frequency domain analysis, the noise signal’s power spectral density (PSD) is first obtained through an FFT algorithm or its equivalent. Next, a mathematical model of the pressure-sensing system is fit to the PSD, from which the system’s response time is calculated. The PSDs of nuclear plant pressure transmitters have various shapes, depending on the plant, the transmitter installation and service, the process conditions, and other effects (Figure 3).
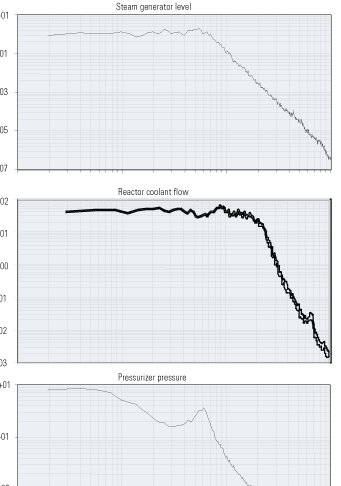
3. Examine the data. Examples of power spectral densities of nuclear plant pressure transmitters. Source: AMS and Springer-Verlag
For time domain analysis, the noise data are processed using a univariate autoregressive (AR) modeling program. This provides the impulse response (the response to a narrow pressure pulse) and the step response, from which the system’s response time is calculated. Typically, the noise data are analyzed in both the frequency domain and time domain, and the results are averaged to obtain the system’s response time.
A few assumptions
The validity of the noise analysis technique for testing the response time of nuclear power plants’ pressure-sensing systems depends on three assumptions:
- The process noise that drives the transmitter is “white,” meaning that it has a flat spectrum or essentially infinite bandwidth. This, of course, is ideal but not readily achievable. However, as long as the process noise’s spectrum has a larger bandwidth than the tested system’s frequency response, the noise analysis results will be reasonably accurate. If, however, the process noise has a smaller bandwidth than the system under test, then the noise analysis results will be dominated by the process bandwidth. The response-time results obtained from the noise analysis technique will therefore be larger than the actual response time of the pressure-sensing system. This is acceptable in nuclear power plants because it produces conservative results.
- The process noise should not have large resonances that can shift the noise spectrum’s rolloff frequency to higher frequencies. If this assumption is not satisfied, corrective measures must be implemented when the data are analyzed or the results are interpreted; otherwise, the response-time values obtained from the noise analysis technique may not be conservative.
- The transmitter to be tested must be predominantly linear. The noise analysis results won’t be valid if the response time of interest is one that can be measured with a small-amplitude test signal at a pressure setpoint that is close to the pressure at which the transmitter normally operates in the plant. Plotting the APD of the raw data as described and checking for skewness (Figure 4) will help verify a pressure sensing system’s linearity.

4. Loss of symmetry. In these amplitude probability densities of transmitters from in-plant testing at a pressurized water reactor, note the nonlinear response of PT-505, indicating that there is a problem with the transmitter or sensing line. Source: AMS and Springer-Verlag
Experience has shown that these three assumptions are normally met for nuclear plant pressure transmitters. For transmitters whose process parameters fluctuate very little or not at all—such as containment pressure transmitters and water storage tank-level transmitters—a method known as a pink noise test can remotely measure response time.
Confirmed accuracy
The accuracy of the noise analysis technique for testing the response time of pressure-sensing systems has been established experimentally using pressure transmitters like those used in nuclear power plants. For each transmitter, the response time was measured first using the ramp method and then using the noise analysis technique. In doing so, the reliability of the ramp test results was first established in the laboratory by ramp-testing pressure transmitters using several ramp rates and by performing repeatability tests. Except for a few outliers, the results proved to be repeatable to better than 0.05 second, with little or no dependence on the ramp rate.
Next, laboratory measurements were made to examine the repeatability of the noise analysis results. As with the ramp tests described previously, the repeatability of the noise analysis results was better than 0.05 second, a few outliers notwithstanding. This is reasonable considering the potential effects that can influence the noise analysis results. From these tests we can draw the following conclusions:
- 79% of response-time results from the noise analysis technique fall within ± 0.05 second of the ramp test results performed on the same transmitters under the same conditions.
- 16% of noise analysis response-time results fall between 0.05 and 0.10 second (±) of the ramp test results.
- 5% of noise analysis response-time results fall within ± 0.10 second of the ramp test results.
Based on all the foregoing data, the nuclear power industry has concluded that the noise analysis technique indicates the response time of pressure-sensing systems to an accuracy of better than 0.10 second.
Testing techniques
Response-time testing using the noise analysis technique has been performed on nuclear power plant pressure transmitters since the early 1980s. Let’s take a look at some examples gleaned from the resulting database of response-time values and records of raw data, PSD plots, and observations. Figure 5 shows noise-test PSDs for two-loop, three-loop, and four-loop pressurized water reactors (PWRs) and a boiling water reactor (BWR) plant. Three PSDs are shown in each case for a pressure, a level, and a flow transmitter in each plant type.
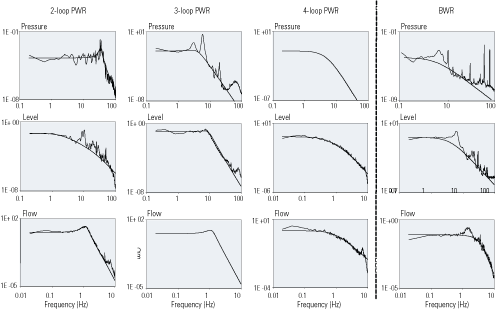
5. Different strokes. Examples of typical power spectral densities of pressure, level, and flow transmitters in PWRs and BWRs. Source: AMS and Springer-Verlag
In several plants, noise testing has been performed on more than one occasion, making it possible to examine the repeatability of the results. Figure 6 shows two PSDs for a steam generator level transmitter in a three-loop PWR plant. The tests were performed approximately three years apart. The results are essentially identical, which indicates that the noise test for this transmitter is very repeatable and that the transmitter has experienced no response time changes over this three-year period.
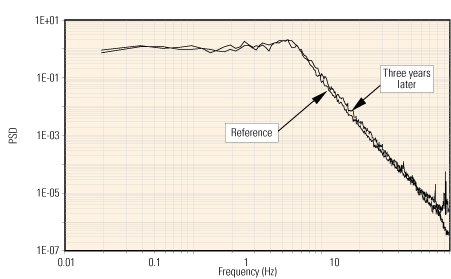
6. Time trends tell a story. The PSDs of a nuclear plant pressure transmitter were measured three years apart. Source: AMS and Springer-Verlag
On another occasion, two redundant transmitters of the same steam generator level signal were tested at the same time in a four-loop PWR. The PSD results are shown in Figure 7. It is apparent that one of these transmitters is significantly faster than the other (by about an order of magnitude). This is unusual because the response times of redundant transmitters are normally expected to be comparable. In this particular case, the two transmitters are from two different manufacturers, and they were probably installed without considering that the two transmitters might have vastly difference response times. This type of difference in response time is also seen in redundant transmitters when there is blockage in the sensing line. However, in the case shown in Figure 7, the difference is not the result of sensing line blockage.
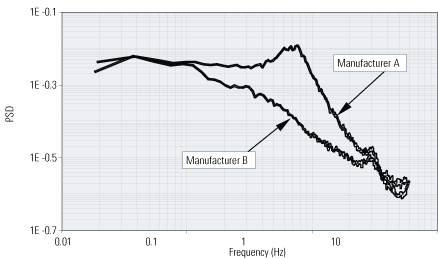
7. Problem transmitter. These PSDs are from two redundant steam generator level transmitters in a four-loop PWR plant. Source: AMS and Springer-Verlag
Detect oil loss
In the late 1980s, some pressure transmitters in nuclear power plants from a particular manufacturer were found to be leaking silicon oil from their sensing cells. Silicon oil is used to transfer pressure signals from the isolation diaphragm to the sensing diaphragm at the center of the sensing cell. Thus, if the oil leaks, both the transmitter’s steady-state (calibration) and dynamic response are affected.
Figure 8 shows the responses of two flow transmitters at a nuclear power station after a reactor coolant pump trip. Note that one transmitter (FT-444) responds quickly to flow reduction as expected, but the other transmitter (FT-445) is extremely sluggish. Later analysis confirmed that the FT-445 suffered from the oil loss problem.
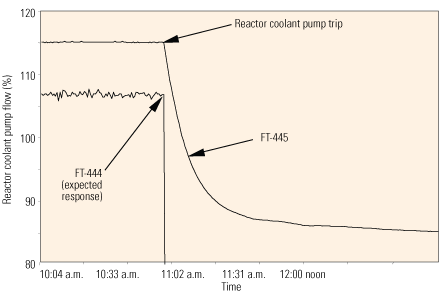
8. Obvious problem. The dynamic response of two transmitters during the shutdown of a nuclear power station illustrates unexpected response. Source: AMS and Springer-Verlag
Figure 9 shows raw noise data for a normal and a failed (from oil loss) transmitter—both used in the same service in an operating nuclear power plant. As expected, the amplitude of the noise signal from the failed transmitter is much smaller than that from the normal transmitter.
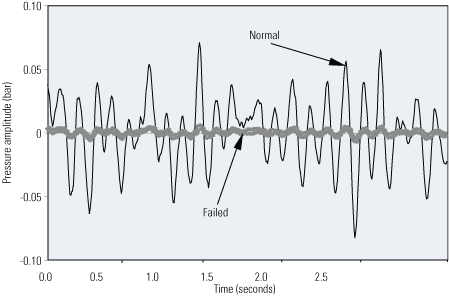
9. Anatomy of a failure. These obviously different lines depict the noise output from testing of a normal and a failed transmitter in an operating nuclear power plant. Source: AMS and Springer-Verlag
After learning of the oil loss problem, the author and his colleagues at Analysis and Measurement Services Corp. (AMS) developed noise diagnostics for detecting the oil loss. This involved calculating the second to the fifth moments of the noise data as well as the ratio of these moments based on noise records above and below the signal’s mean value. The first moment of noise data is its mean value, its second moment is the variance, and the third moment is skewness.
Table 1 is an example of noise diagnostic descriptors for four steam generator level transmitters in a PWR plant. Note that the values of the descriptors for LT528 are much different than for the other transmitters. This transmitter was later removed from the plant and sent to the manufacturer, where it was determined that the problem was caused by oil loss in the transmitter’s sensing module. This and similar cases demonstrated that the noise analysis technique can provide a useful means for diagnosing oil loss.

Table 1. Diagnose oil loss from instruments. These oil-loss diagnostic results were obtained from tests in a nuclear power plant. Note the values of descriptors for LT 528. This transmitter was later removed and sent to the manufacturer, where it was determined that the problem was caused by oil loss in the transmitter’s sensing module. Source: AMS and Springer-Verlag
Fortunately, the root cause of the oil loss problem in this manufacturer’s transmitters was identified and resolved by the manufacturer very quickly. Therefore, the nuclear industry did not suffer any adverse consequences. Also, because the problem was successfully resolved early, use of the noise diagnostics for detecting oil loss did not become routine in nuclear power plants.
Response time degrades
The response time of nuclear plant pressure transmitters does degrade, but this is not as prevalent a problem for pressure transmitters as it is for resistance temperature detectors (RTDs). Conversely, calibration drift is more of a problem in pressure transmitters than it is in RTDs. Figure 10 summarizes the results of a research project to quantify the effects of normal aging on the calibration and response time of a sample of nuclear-grade pressure transmitters. It is clear that aging affects the calibration of pressure transmitters more than their response time.
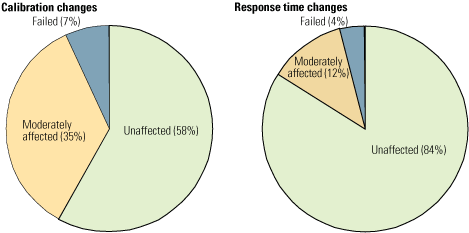
10. Transmitter failure profile. These results are from experimental research on the performance of aging nuclear plant pressure transmitters. Source: AMS and Springer-Verlag
Table 2 shows response time results from noise analysis testing performed on 16 transmitters over five years. The measurements were made using the noise analysis technique. Only one transmitter suffered response time degradation of about 30% after 36 months of service, and this was later determined not to be due to the transmitter but to a sensing line blockage. This finding is consistent with the nuclear industry’s experience that response-time degradation in pressure transmitters is more often due to sensing line blockages than to degradation in the transmitter itself.
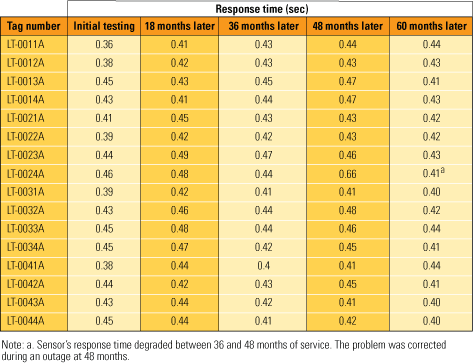
Table 2. Trend response times. Here are typical results of trending of response time for a group of nuclear plant pressure transmitters. Source: AMS and Springer-Verlag
This article is based on material summarized and excerpted from Chapter 9, pages 195-225 of the author’s book, Maintenance Process Instrumentation in Nuclear Power Plants (Springer-Verlag Berlin Heidelberg, 2006). Used with the kind permission of Springer Science and Business Media.
—H.M. Hashemian (hash@ams-corp.com) is president and CEO of Analysis and Measurement Services Corp.


