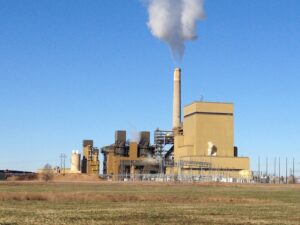
Natural gas electrical generation has increased significantly in recent years due to its cost advantage and reduced carbon footprint relative to coal. Many utilities are shifting to natural gas as a bridge fuel on their path to the ultimate goal of a net-zero carbon future.
With the increase in gas-fired generation, the evaluation and demonstration of advanced continuous emissions monitoring (CEM) technologies, such as in-situ optical-based monitors, for combustion turbine systems are needed to provide utilities with essential information to support technology selection and implementation decisions.
In parallel with the trend of increasing gas generation, regulatory scrutiny on combustion turbine (CT) emissions is projected to increase as utilities operate their CT fleets dynamically in response to the variability of wind and solar resources, which are playing an expanding role in the generation mix. Flexible CT operation may alter emissions levels and environmental control system performance, making effective use of advanced CEM systems a high priority given their faster time response and increased representativeness associated with the line-of-sight average measurement.
Laser-based in-situ monitoring systems have the potential to improve stack CEM measurement representativeness, time response, accuracy, as well as reducing lifecycle operating and maintenance costs. Although advanced optical emissions monitoring technologies for NO, NO2, CO, NH3, H2O, and CO2 are commercially available that may offer potential advantages over traditional monitors, until recently their technical and economic performance from a compliance monitoring perspective had not been evaluated under CT field operating conditions.
To provide real-world performance data and hands-on experience with optical CEM technology, the Electric Power Research Institute (EPRI) has been conducting a series of independent third-party field demonstrations whose findings help support informed decisions regarding optical CEM technology options. Most recently EPRI successfully demonstrated in-situ optical-based CEM monitors on a gas turbine combined cycle stack, and is working with industry and the U.S. Environmental Protection Agency (EPA) to secure acceptance of this monitoring approach. The demonstrations are based on a foundation of more than 30 years of research and development (R&D) projects that have supported a range of CEM applications in the utility industry.
Optical CEM
Because molecules absorb light at specific wavelengths, advanced in-situ optical CEM monitoring systems measure gas concentrations directly within the flue gas flow, without extracting and transporting samples for external analysis. In general, in-situ systems require significantly less maintenance than extractive systems that expose auxiliary equipment to the flue gases and typically incorporate sample probes, heated umbilical sample lines, and sample pumps, as well as sample conditioning systems.

In This Issue
Full issueIn-situ optically based measurements of NO, NO2, CO, NH3, H2O, and CO2 can be accomplished with ultraviolet (UV)- and infrared (IR)-based monitoring systems that have a relatively high-power-density light source that is tailored to absorption characteristics of specific species of interest. Unlike process control monitor applications, compliance measurements must meet rigorous quality assurance requirements that are stipulated in the Code of Federal Regulations 40 CFR Part 75 and Part 60.
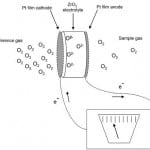
Performance Specification 18 (PS-18) for hydrochloric acid (HCl) flue gas measurements also provides further guidance for potential optical CEM measurement requirements, albeit specifically written for HCl tunable diode laser applications on coal-fired boilers. Based on PS-18, daily calibrations and calibration drift tests will most likely require inline audit cells where National Institute of Standards and Technology (NIST) traceable calibration gases can be introduced, or reside in a sealed fiber coupled audit gas cell. Figure 1 shows an inline flow through audit gas cell that is consistent with a PS-18 monitor calibration approach.
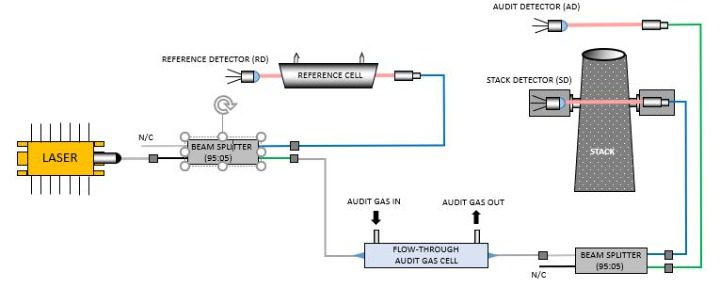
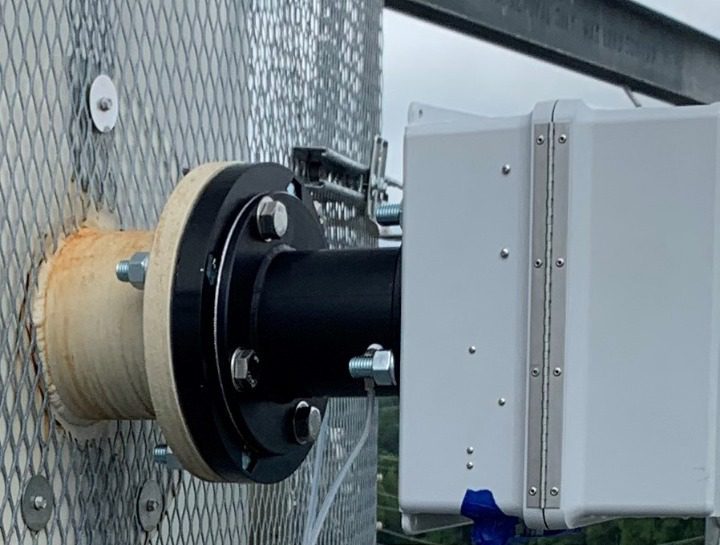
It should be noted, however, that light sources for different specie measurements can present application limitations due to reduced light power levels not allowing fiber-coupled connections in some instances. In these cases, flange connected flow through measurement cells are typically required (Figure 2).
Field Evaluation on GTCC
In collaboration with a host utility and other interested utilities, EPRI researchers conducted a field evaluation of an in-situ optical CEM system on a stack of a gas turbine combined cycle (GTCC) unit. While the system was configured to measure NO, NO2, CO, NH3, O2, CO2, and H2O using three different lines of sight, results from this demonstration identified a simplified approach for gas turbine applications that measure NO, NO2, and NH3 (if required) with an Ultraviolet Differential Optical Absorption Spectroscopy (UV-DOAS) monitor using one line of sight, and CO, H2O, and CO2 over a second line of sight with infrared laser-based measurements. Monitor performance was evaluated in comparison to reference method data obtained during three separate relative accuracy test audits (RATAs), with the unit firing natural gas or low-sulfur oil.
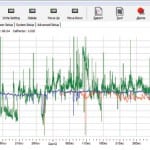
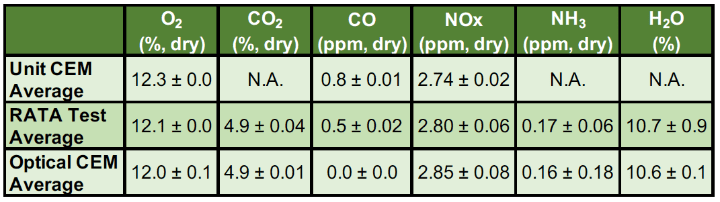
Results from this demonstration highlighted optical CEM measurement and accuracy capability (Table 1). Measurements across the nominal 6-meter-diameter stack with 250F flue gas yielded results that passed RATA criteria for each specie. A key potential benefit of an in-situ optical measurement approach is the potential to significantly reduce annual CEM operations and maintenance (O&M) costs. CEM O&M cost savings associated with in-situ line-of-sight average measurements versus single-point extractive measurement approaches accrue based on reduced calibration gas consumption, fewer spare parts to inventory, the potential for reduced service by virtue of having fewer moving parts (such as sample pumps), as well as reduced electrical power needed for system operation.
Issues and Questions
Implementing an optical CEM system can present several application-related issues. For example, the recent optical CEM demonstration was conducted with each of the monitors located on the stack platform, due to some of the optical CEM technologies currently having limitations in regard to the distance that their optical signal can be transmitted.
While cross-stack in-situ optical CEM monitoring systems can provide more cost-effective CEM measurements than traditional single-point extractive CEM systems, their application on gas turbines would be significantly enhanced if they could be installed on the flue gas duct upstream of the stack breeching, thereby enabling improved physical access in the event of monitor service. As gas turbine selective catalytic reduction (SCR) systems frequently implement a one-dimensional ammonia injection grid (AIG), with horizontal reagent injection lances located across different elevations of the duct, a representative CEM measurement across the flue gas duct upstream of the stack may likely require a diagonal measurement path in order to provide a line of sight that averages across a portion of each of the multiple reagent injection lances.
Given typical gas turbine flue gas duct dimensions, this would require implementation and maintenance of an aligned optical path along a line of sight that can be on the order of 15 meters to 25 meters. With flue gas temperatures ranging from 750F to 1,200F, depending on the gas turbine platform, as well as rapidly changing flue gas temperatures resulting from flexible operations in response to shifting renewable energy generation, this can pose optical signal alignment complexities due to changes in the thermal expansion/contraction of the duct on which sample ports and optical enclosures are mounted.
An additional potential issue for the calibration of some species stems from the inline reference cell concentration needing to provide a dynamic spike equivalent relative to a target span concentration that is relative to the measured flue gas concentration. As the inline reference gas cell (Figure 1) measures the reference gas concentration at a different path length, temperature, and pressure than the process gas, the equivalent dynamic spike concentration at process gas conditions is typically calculated by adjusting the measured NOx concentration in the reference cell with a wavelength specific absorption line strength correction, as well as a density correction.
In the case of NOx, as one example, the high-span value, and associated reference gas concentrations, are derived from the maximum potential concentration (MPC). The simplest and broadest interpretation for the MPC is provided in 40 CFR Part 75 – Appendix A – Section 2.1.2.1 Maximum Potential Concentration, in Table 2-2, which is 200 ppm NOx for existing and new CTs permitted to fire either oil or natural gas. While there are alternate methods provided to determine the MPC (such as NOx emission testing, at least 720 hours of historical CEM data, etc.), data must be obtained while firing the highest NOx emitting fuel (typically fuel oil) with data obtained upstream of any add-on NOx controls (such as SCR).
Once the MPC is determined, the maximum expected concentration (MEC) for sites with add-on NOx controls, such as SCR, is generally obtained from Equation A-2 in Section 2.1.1.2., which is:
MEC = MPC x (100 – RE) / 100
where:
MEC = maximum expected concentration
MPC = maximum potential concentration
RE = expected average design removal efficiency of control equipment (%)
For a gas turbine with SCR, a separate MEC value is determined for each type of fuel or fuel blend. The broadest range of gas turbine applications should result from a NOx optical CEM monitor capable of using the MEC calculated from Equation A-2 (Table 1). While lower MEC values could ultimately be determined based on “NOx Emission Testing” or “Historical CEM Data,” they will need to be based on the highest NOx emitting fuel, which does not typically have long operating time periods due to cost considerations. As noted above, however, “NOx Emission Testing” under oil-fired operating conditions could reduce the 200 ppm MPC value by a factor of two. For CTs restricted to natural gas–firing only, “NOx Emission Testing” could reduce the MPC down to a value as low as 20 ppm. NOx MEC values calculated in Table 1 would be reduced accordingly.
For purposes of this example, a high-span value of 200 ppm NOx is assumed, along with a low-span value of 50 ppm NOx. From these span values, one can then derive required low-, mid-, and high-reference gas concentrations required to conduct a linearity test under Part 75. An example computation for a dynamic spike concentration that is equivalent to 80% of a 200 ppm NOx high span for a GTCC based on a 0.25-meter reference cell length and 6.2-meter stack diameter would be approximately 3,600 ppm NOx. As the measurement method focuses solely on NOx, the reference gas concentrations can be adjusted as needed to provide a NO + NO2 mixture that provides an overall NOx dynamic spike that incorporates measurement of both NO and NO2 by the NOx monitor.
One can readily see that reference gas concentrations required to provide target dynamic spike concentrations can be quite high, and in some cases, create safety concerns for situations where reference gas concentrations are hazardous (such as CO, NO2, etc.), or a situation is created where even a 100% reference gas concentration cannot generate the target dynamic spike concentration value (such as O2).
EPRI’s demonstration projects aim to address these, and other questions, while gaining first-hand practical experience with installation and operation of optical CEM systems. One such project that is being initiated this year focuses on the application of an optical CEM system installed on the flue gas duct upstream of the stack breeching on a simple-cycle gas-fired CT.
Gas Turbine Off-Stack In-Situ Optical CEM Demonstration
Building on the initial demonstration of an in-situ optical CEM system installed on a stack platform described above, the current EPRI demonstration project is evaluating different off-stack measurement options that can enhance optical CEM monitor physical access. Application of CEM monitors upstream of the RATA ports located on the stack is allowed, with the stipulation that the CEM monitors must still pass a RATA based on data collected from stack RATA test ports.
The primary benefit associated with optical CEM monitor installation locations on the flue gas duct leading to the stack breeching is their enhanced physical access for routine O&M relative to installations located on the stack platform. One of the key research questions addressed in this project is the identification and demonstration of an optical configuration that can maintain the optical CEM alignment over an extended diagonal path length that is on the order of 20 meters over a range of unit operating temperatures. Three central questions to be addressed through performance of this project include:
- Representativeness of line-of-sight measurements across the duct upstream of the stack relative to the RATA test elevation on the stack.
- Identification and test of UV sources that can transmit path lengths greater than 10 meters.
- Optical system requirements to maintain system alignment so that CEM measurements can be obtained in a sustainable manner during unit startup, flexible operations, and shutdown.
Optical CEM monitors will be evaluated in context of signal power stability, data availability, and accuracy in context of comparisons against a certified extractive CEM measurement system, and/or performance of RATA tests. Completion of the project scope is intended to provide the necessary data for project funders to better understand installation locations for gas turbine optical CEM monitors that provide representative measurements and easier physical access than on the stack for routine O&M. Documentation of monitor calibration procedures will also assist utilities’ understanding of optical CEM application requirements. Additional information on this project can be downloaded at: https://www.epri.com/research/products/000000003002022794.
Value of Sustained Collaborative R&D
The optical CEM demonstrations described here build on a foundation of EPRI’s continuous emissions monitoring and measurement program’s 30-plus years of collaborative R&D. As an independent research organization, EPRI provides objective third-party evaluation and demonstration of emerging and new technologies in collaboration with electric utilities, as well as equipment vendors and other organizations. Such collaborations produce valuable knowledge that would be prohibitively costly or impossible to obtain by a single utility or organization. Some other examples of EPRI R&D in support of CEM applications include:
- CEM guideline documents.
- Assessing Fourier Transform Infrared (FTIR) spectrometer formaldehyde measurement test methods for gas turbines in response to a potential regulatory emissions mandate.
- Stack velocity accuracy improvements in support of heat rate improvement and CO2 emissions reduction.
- Mercury CEM monitoring on coal-fired units in support of cost-effective regulatory compliance.
- HCl tunable diode laser stack measurements.
- Sulfuric acid mist measurements in support of sorbent injection process optimization and emissions compliance.
Annual CEM User Group Conference and Exhibit
EPRI will host the 30th meeting of the Continuous Emissions Monitoring User Group Conference at the Indianapolis Hyatt Regency & Conference Center on Wednesday, May 11, and Thursday, May 12, 2022. This is a collaborative forum for the electric utility industry to address CEM-related issues. An exhibit area will be available for equipment and system suppliers.
The annual conference brings together the utility industry, government regulators, and CEM equipment providers to share experience and solutions to common operating problems, and to explore emerging monitoring technologies. Electric utility environmental managers, engineers, and technicians responsible for CEM systems are encouraged to attend.
Sessions will include presentations on regulatory changes (methods, monitoring, reporting, etc.); cybersecurity; compliance and process monitoring (coal and gas-fired applications, and new technologies); particulate and flow monitoring; and more. To register for the conference, visit: https://web.cvent.com/event/78033dcc-a0d4-472f-ae29-b1abdddfcb79/summary.
—Richard Himes, PE is a technical executive at EPRI where he directs research activities in combustion and post-combustion diagnostic measurements, boiler performance, emissions control, and holistic assessments of emissions interrelationships. His responsibilities include project management, data analysis, results reporting and presentations, as well as developing multi-year research plans.